Appendix E
Supplementary Material on ”Antagonism between substitutions in
-lactamase
explains a path not taken in the evolution of bacterial drug resistance”
The work in this appendix is published in: Brown, C.A., Hu, L., Sun, Z., Patel, M.P., Singh, S., Porter, J.R.,
Sankaran, B., Venkataram Prasad, B.V.V., Bowman, G.R., Palzkill, T., Antagonism between substitutions in
-lactamase
explains a path not taken in the evolution of bacterial drug resistance, J.Biol., Chem., 2020,
doi:10.1074/jbc.RA119.012489 [437]
E.1 Supplementary Data
Table E.1: Table S1. X-ray crystallography data collection and refinement statistics for
CTX-M-14 mutant enzymes. *Values in parentheses represent the highest-resolution bin.
|
|
|
|
|
|
|
| | P167S/D240G | E166A/D240G | E166A/P167S/ | E166A/D240G- | E166A/P167S/ | E166A/P167S/ |
|
|
|
|
|
|
|
| | | | D240G | CTX | D240G-CTX-1 | D240G-CTX-2 |
|
|
|
|
|
|
|
| PDB ID | 6V5E | 6V6P | 6V6G | 6V7T | 6V83 | 6V8V |
|
|
|
|
|
|
|
| Data collection | | | | | | |
|
|
|
|
|
|
|
| Space group | P 41 21 2 | P 41 21 2 | P 32 2 1 | P 21 | P 41 21 2 | P 32 2 1 |
|
|
|
|
|
|
|
| a, b, c () | 42.2, 42,2, 261.6 | 41.9, 41.9, 259.2 | 41.4, 41.4, 231.1 | 45.1, 107.3, 47.8 | 42.4, 42.4, 262.7 | 41.3, 41.3, 231.6 |
|
|
|
|
|
|
|
| , , (°) | 90, 90, 90 | 90, 90, 90 | 90, 90, 120 | 90, 99.9, 90 | 90, 90, 90 | 90, 90, 120 |
|
|
|
|
|
|
|
| Resolution Range (Å) | 41.70 - 2.30 | 39.89 - 1.55 | 35.88 - 1.50 | 35.48 - 1.34 | 41.82 - 1.80 | 32.44 - 1.80 |
|
|
|
|
|
|
|
| | (2.38 - 2.30) | (1.61 - 1.55) | (1.56 - 1.50) | (1.39 - 1.34) | (1.84 - 1.80) | (1.87 - 1.80) |
|
|
|
|
|
|
|
| R-merge (%) | 8.4 (12.1) | 9.7 (18.7) | 5.6 (46.5) | 4.7 (11.8) | 9.4 (60.6) | 8.7 (11.8) |
|
|
|
|
|
|
|
| I/sigma | 17.4 (9.6) | 16.6 (10.3) | 30.8 (5.1) | 17.1 (8.5) | 31.3 (5.4) | 11.7 (4.8) |
|
|
|
|
|
|
|
| Multiplicity | 7.0 (6.4) | 11.8 (14.0) | 8.4 (10.6) | 3.7 (3.7) | 16.7 (19.9) | 4.8 (2.0) |
|
|
|
|
|
|
|
| Completeness (%) | 88.3 | 85.5 | 98.8 | 99.4 | 100 | 97.9 |
|
|
|
|
|
|
|
| Wilson B-factor () | 29.4 | 10.3 | 12.1 | 9.1 | 18.2 | 14.1 |
|
|
|
|
|
|
|
| | | | | | | |
|
|
|
|
|
|
|
| Refinement | | | | | | |
|
|
|
|
|
|
|
| Molecules per asymmetric unit | 1 | 1 | 1 | 2 | 1 | 1 |
|
|
|
|
|
|
|
| No. of unique reflections | 10104 (880) | 30051 (2829) | 37869 (3494) | 99523 (9924) | 23526 (2299) | 21924 (1871) |
|
|
|
|
|
|
|
| R-work/R-free (%) | 18.5 / 25.1 | 16.8 / 19.4 | 18.3 / 21.7 | 14.3 / 16.1 | 17.1 / 20.8 | 14.9 / 18.9 |
|
|
|
|
|
|
|
| No. of protein residues | 263 | 263 | 260 | 526 | 261 | 260 |
|
|
|
|
|
|
|
| Ramachandran | | | | | | |
|
|
|
|
|
|
|
| Favored (%) | 98.5 | 98.1 | 97.7 | 98.1 | 98.5 | 98.1 |
|
|
|
|
|
|
|
| Outliers (%) | 0 | 0 | 0.39 | 0.38 | 0 | 0.39 |
|
|
|
|
|
|
|
| Average B-factor () | 31 | 14.2 | 21.2 | 14.1 | 23.3 | 16.6 |
|
|
|
|
|
|
|
| Protein | 30.8 | 12.4 | 19.6 | 11.7 | 21.1 | 14.4 |
|
|
|
|
|
|
|
| Ligand | - | 23.4 | 37.3 | 18.6 | 62.2 | 28.7 |
|
|
|
|
|
|
|
| Solvent | 34.7 | 29.1 | 32.1 | 26.7 | 36.3 | 30.2 |
|
|
|
|
|
|
|
| RMS deviations | | | | | | |
|
|
|
|
|
|
|
| Bond length () | 0.003 | 0.011 | 0.007 | 0.006 | 0.006 | 0.011 |
|
|
|
|
|
|
|
| Bond angles (°) | 0.685 | 1.16 | 0.92 | 0.93 | 0.96 | 1.204 |
|
|
|
|
|
|
|
| |
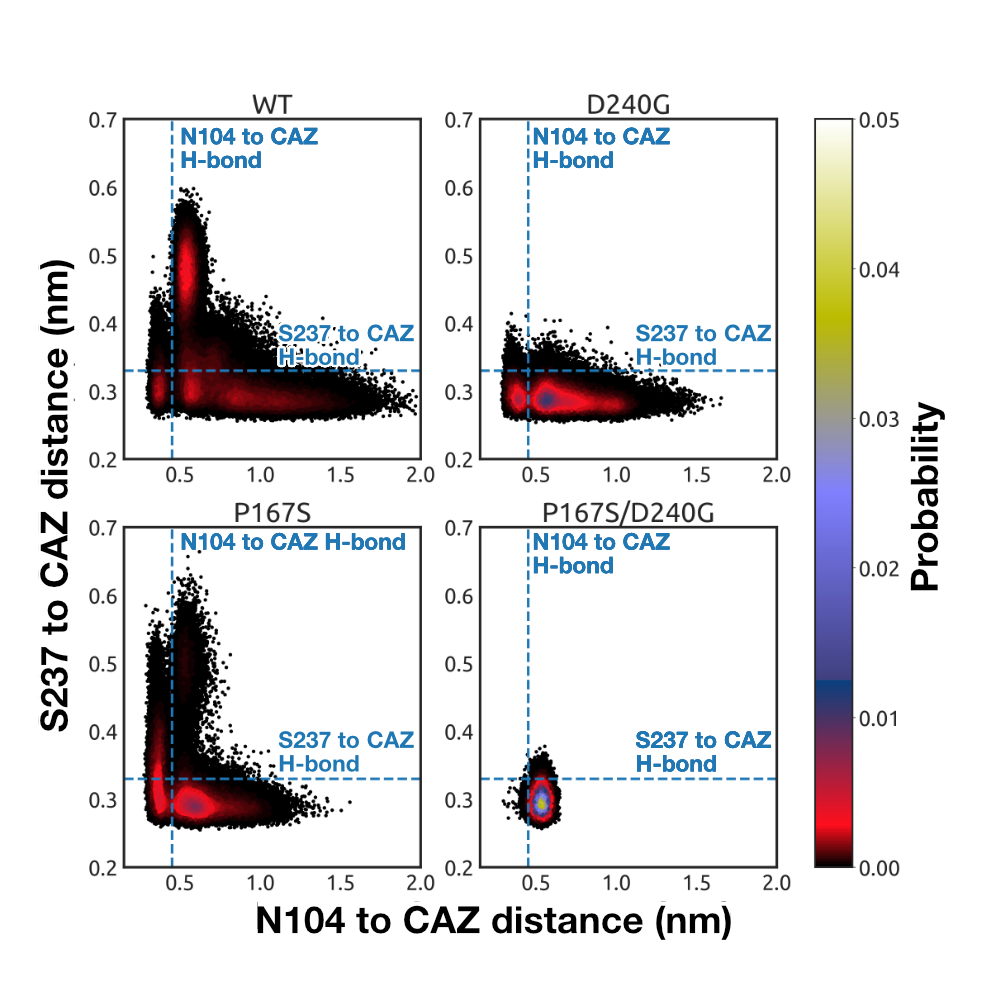
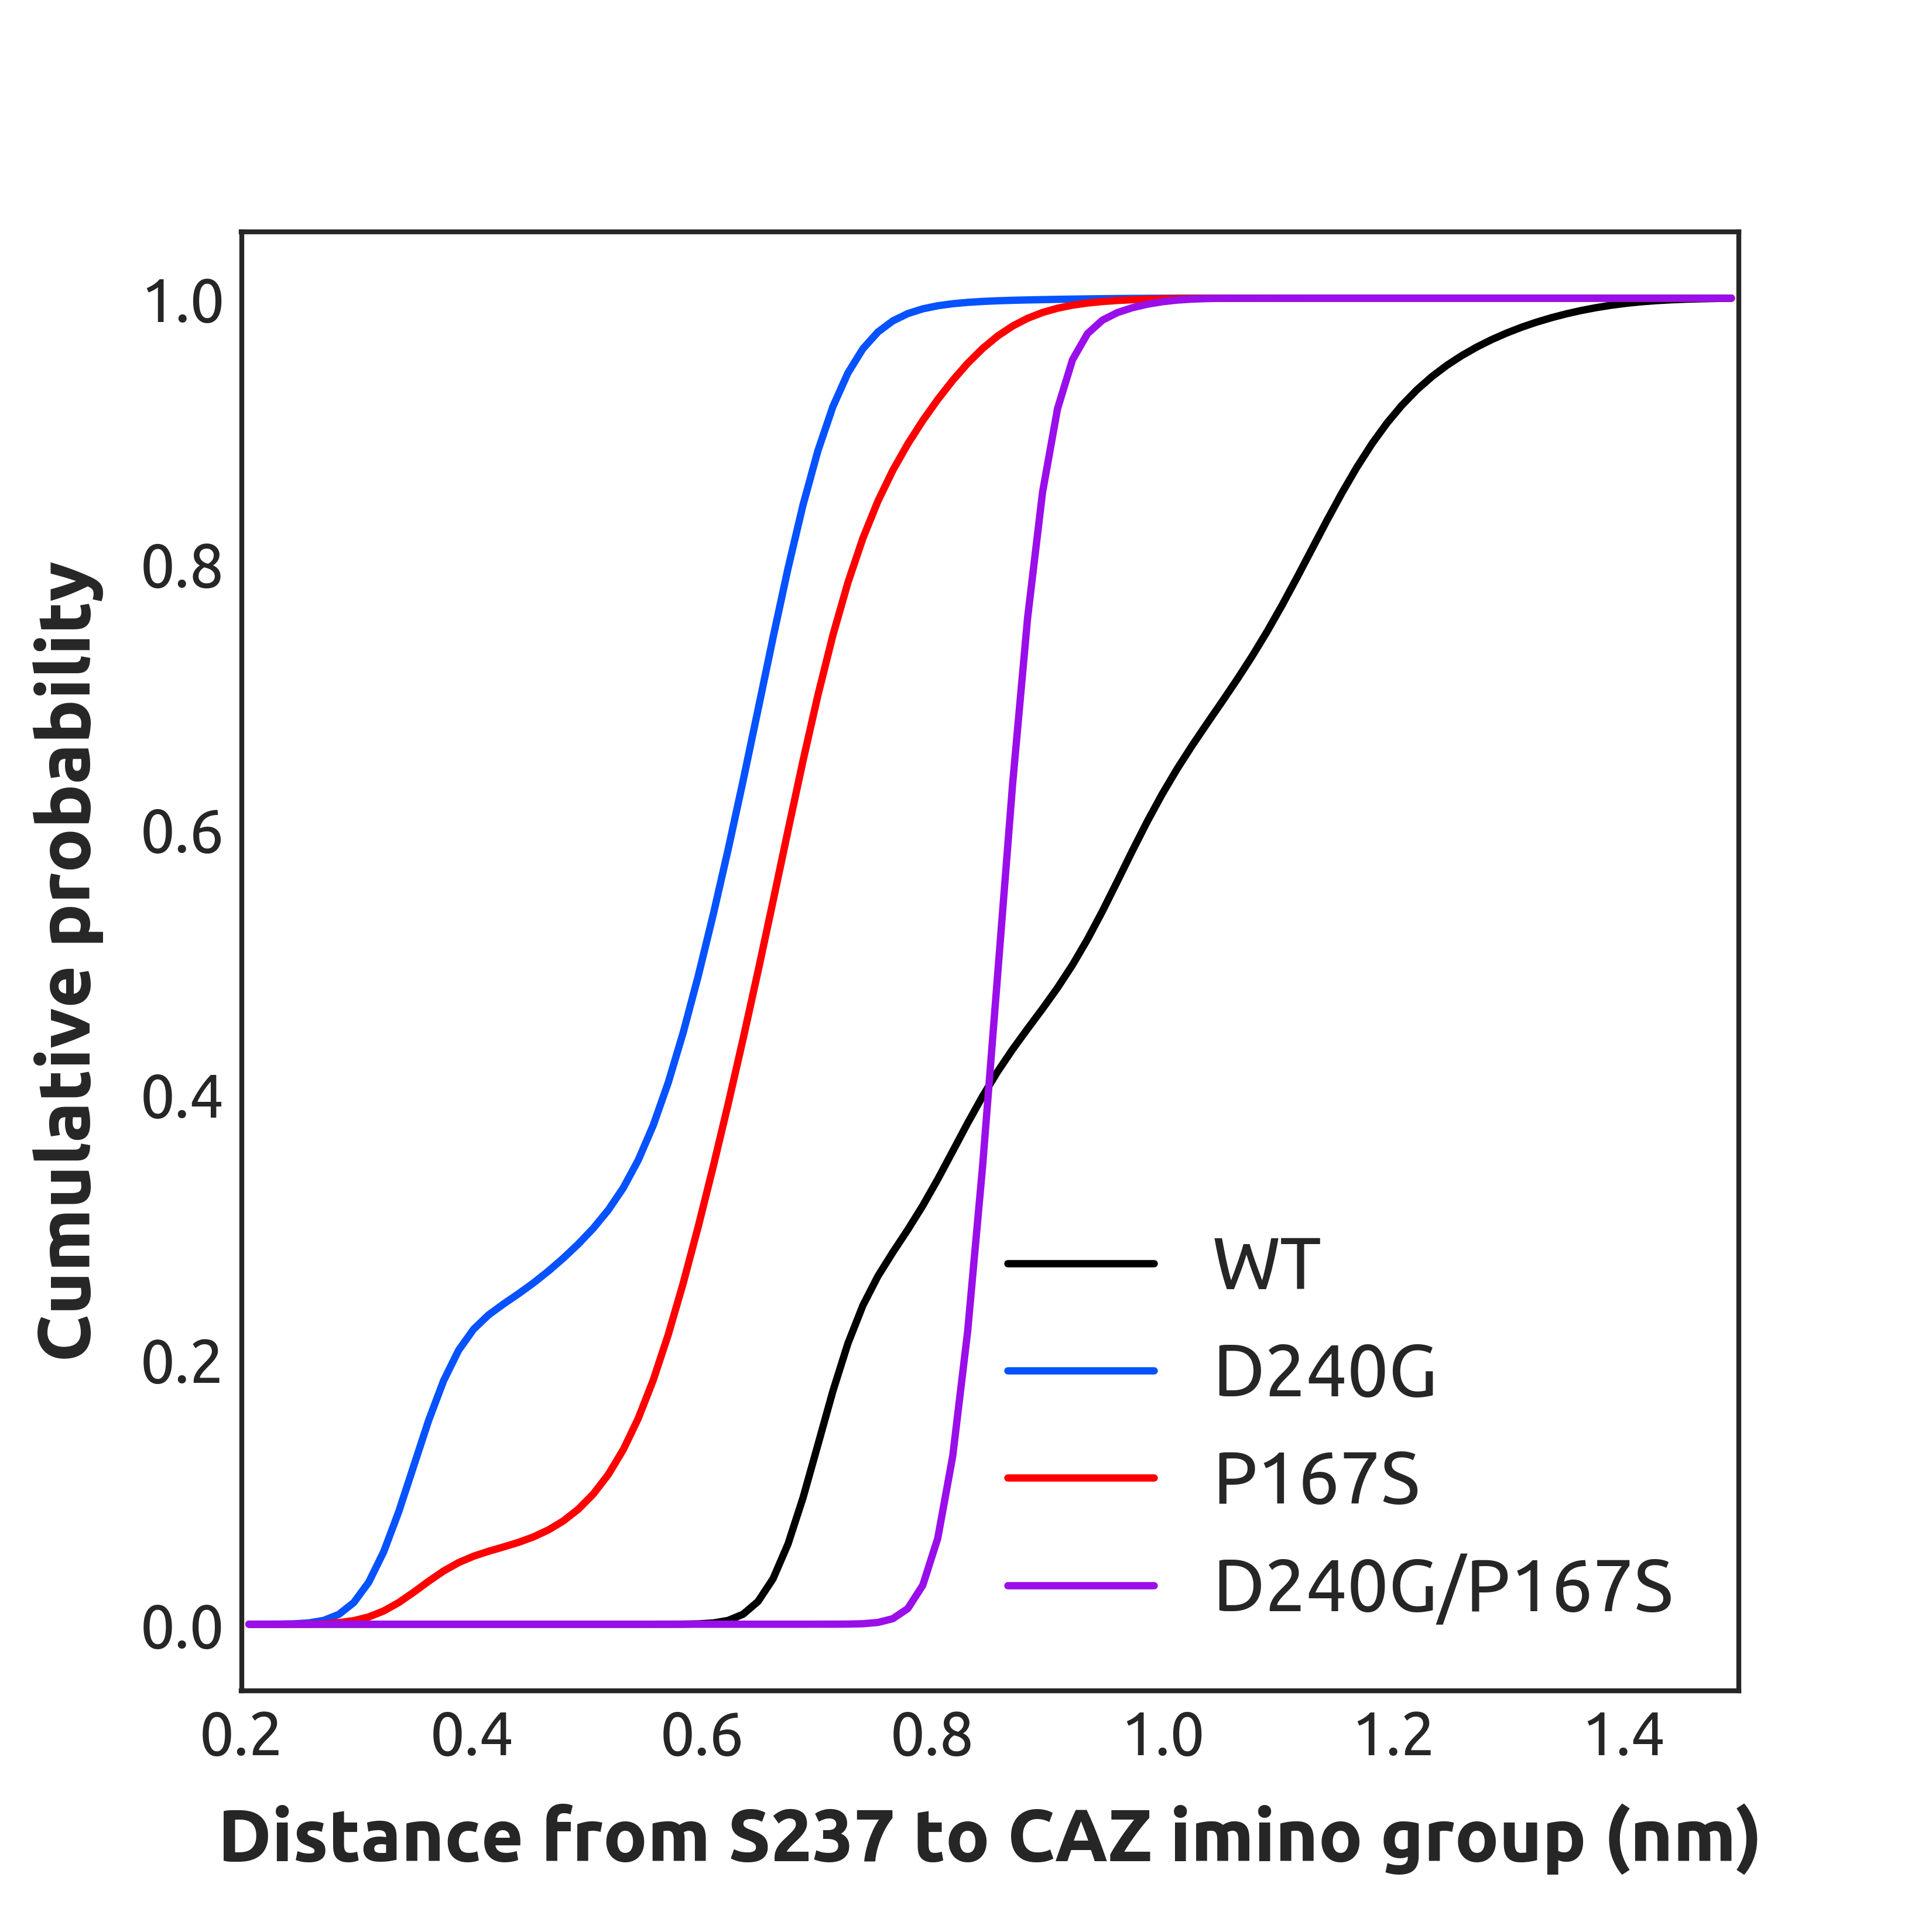
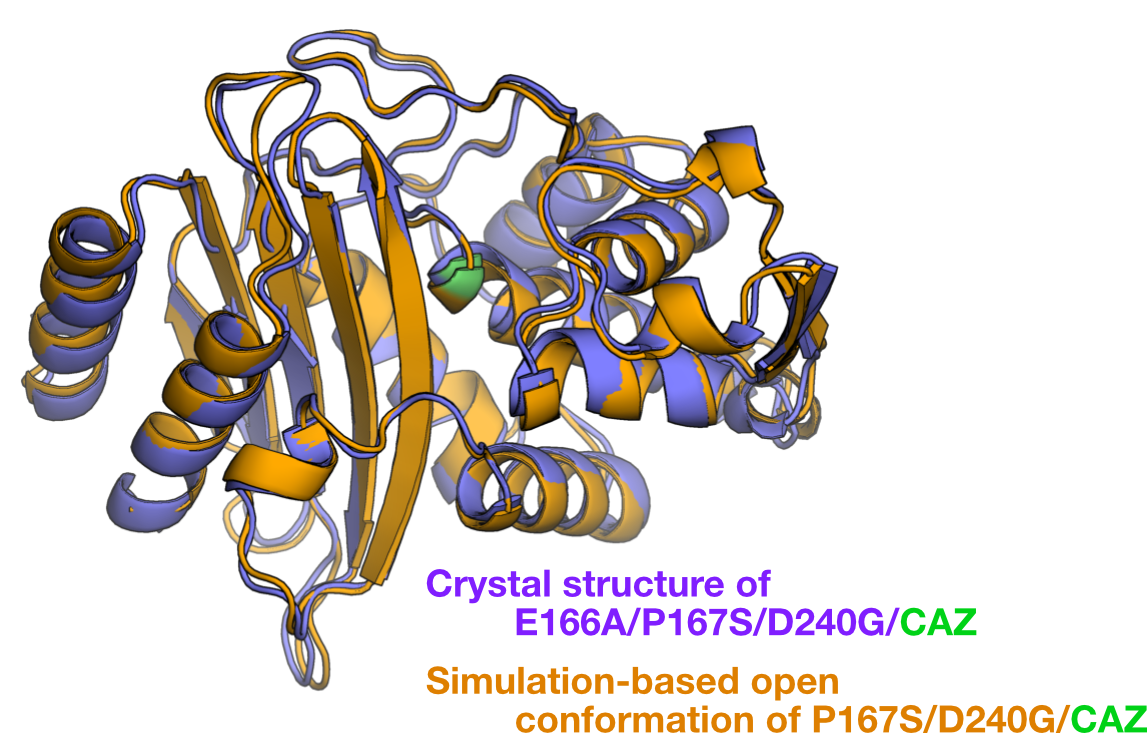
E.2 Supplementary Figures