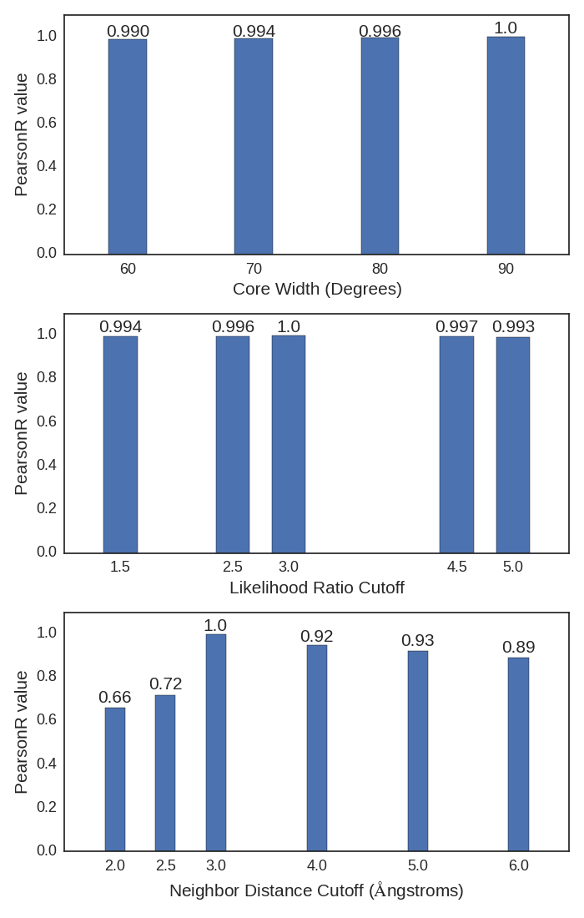
Figure A.1: Pearson Correlation Coefficients (PearsonR) between the CARDS results
presented in the main text and those with varying A. the core width, B. the likelihood ratio
cutoff, and C. the neighbor distance cutoff.
The work in this Appendix is published in: Singh, S., and Bowman, G.R., Quantifying allosteric communication via both concerted structural changes and conformational disorder with CARDS. Journal of Chemical Theory and Computation. 13:1507-1517, 2017. PMID: 28282132. [493]
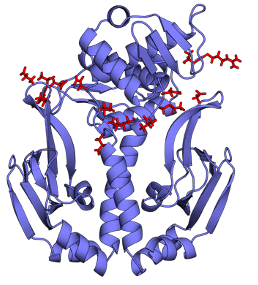
All simulations were carried out on GROMACS (version 5.1.1) [222, 145] using periodic boundary conditions in a dodecahedron with explicit water solvent. Simulations were carried out at 300K using the AMBER03 [146] force field with the TIP3P water model [143]. The starting conformations of wild-type apo and cAMP-bound CAP were generated by placing crystallographic structures (PDB ID: 4N9H and 1CGP respectively) [130, 129] into separate dodecahedron boxes that extended 1.0 nm from the protein surface in any direction. Starting conformations fore the S62F variant were generated using the PyMol [144] mutagenesis tool. Each system was then minimized independently with the steepest-descent algorithm until the maximum force fell below 1000 kJ/mol/min using a step size of 0.01nm and a cutoff distance of 1.2nm for the neighbor list, Coulomb interactions, and van der Waals interactions. For equilibration runs, all bonds were constrained with the LINCS algorithm [226] and virtual sites [228] were used to allow for a 4fs time step. As before, cut-offs of 1.0 nm were used for the neighbor list, Coulomb interactions, and van der Waals interactions. The Verlet cutoff scheme was used for the neighbor list, and Particle Mesh Ewald [494] was employed for the electrostatics (with a grid spacing of 0.12nm, PME order 4, and tolerance 1e-5). The stochastic velocity rescaling (v-scale) thermostat [224] was used to hold the temperature at 300K, and the Berendsen barostat [495] was used to bring the system to 1 bar pressure. For the production runs, the position restraint was removed and the Parrinello-Rahman barostat [227] was employed. Conformations were stored every 10 ps. For each system, three 500ns runs were conducted totaling to 1.5s of aggregate simulation time per system.
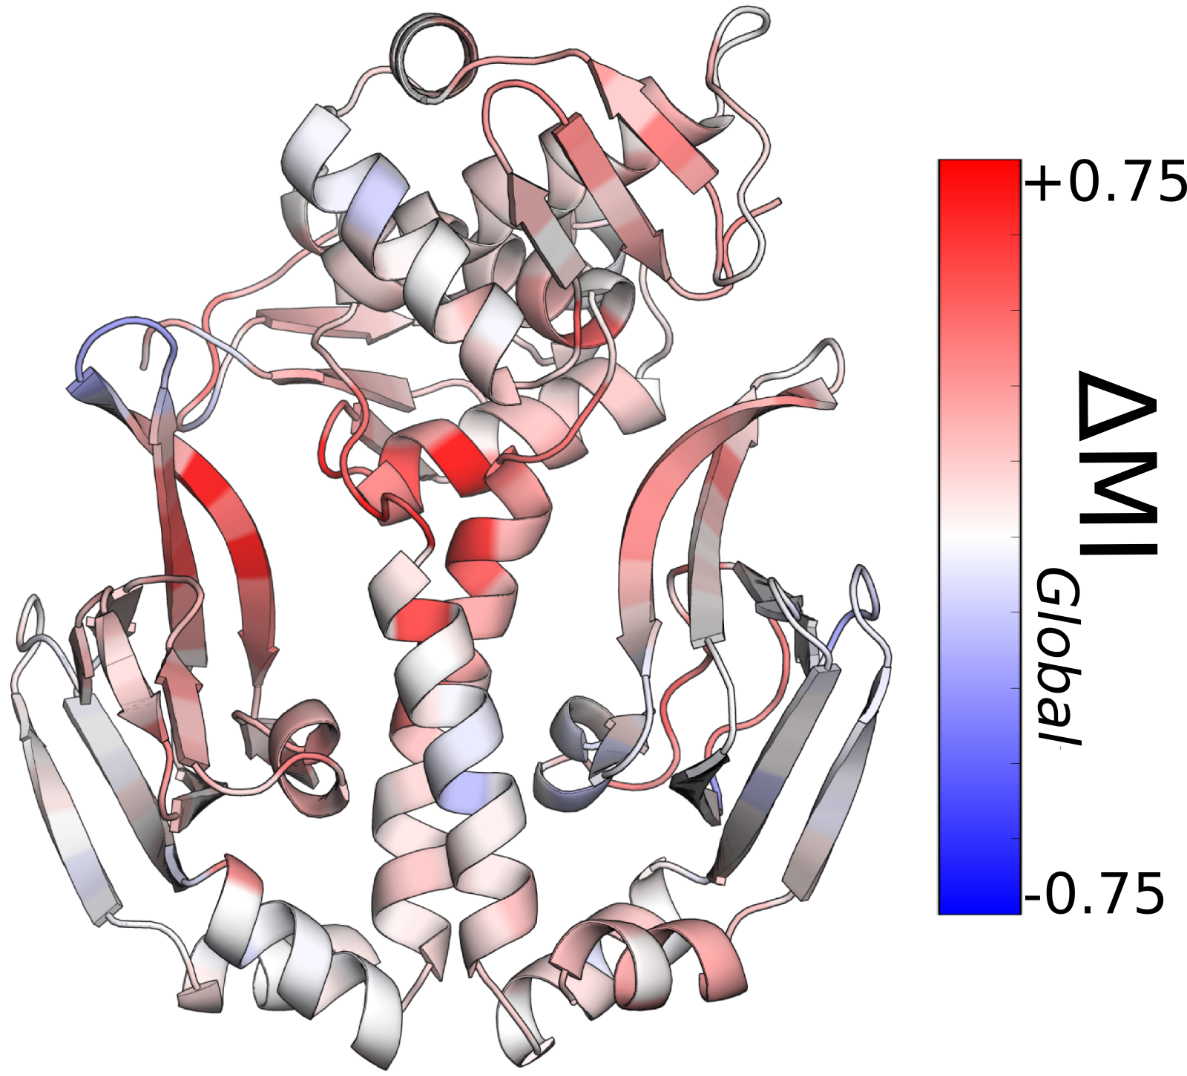
Dihedral angles were extracted using the MDTraj Library [148] (v. 1.7). Mappings were all drawn in PyMol (version 1.7) [144], and all figures were constructed in Inkscape (v. 0.48).
We varied all the cutoff values employed in the CARDS algorithm to ensure the robustness of our results. Specifically, we varied the core width from 60° to 90°, the likelihood ratio cutoff from 1.5 to 5.0, and the neighbor distance cutoff from 2-6Å. Fig. A.1 demonstrates that the communication to the CBD does not change dramatically as these parameters are varied.