Chapter 3
Simulation of spontaneous G protein activation reveals a new intermediate driving GDP
unbinding
This chapter is adapted from the following publication:
Sun, X.and
Singh, S.,
Blumer, K.J., and Bowman, G.R., Simulation of spontaneous G protein activation reveals a new intermediate
driving GDP unbinding. eLife, 7, October 2018, https://doi.org/10.7554/eLife.38465.001 [48]
Authors
contributed equally to this work
3.1 Abstract
Activation of heterotrimeric G proteins is a key step in many signaling cascades. However, a complete
mechanism for this process, which requires allosteric communication between binding sites that are
30 Å
apart, remains elusive. We construct an atomically detailed model of G protein activation by
combining three powerful computational methods: metadynamics, Markov state models (MSMs), and
CARDS analysis of correlated motions. We uncover a mechanism that is consistent with a
wide variety of structural and biochemical data. Surprisingly, the rate-limiting step for
GDP release correlates with tilting rather than translation of the GPCR-binding helix 5.
-Strands
1-3 and helix 1 emerge as hubs in the allosteric network that links conformational changes in the
GPCR-binding site to disordering of the distal nucleotide-binding site and consequent GDP release.
Our approach and insights provide foundations for understanding disease-implicated G protein
mutants, illuminating slow events in allosteric networks, and examining unbinding processes with
slow off-rates.
3.2 Introduction
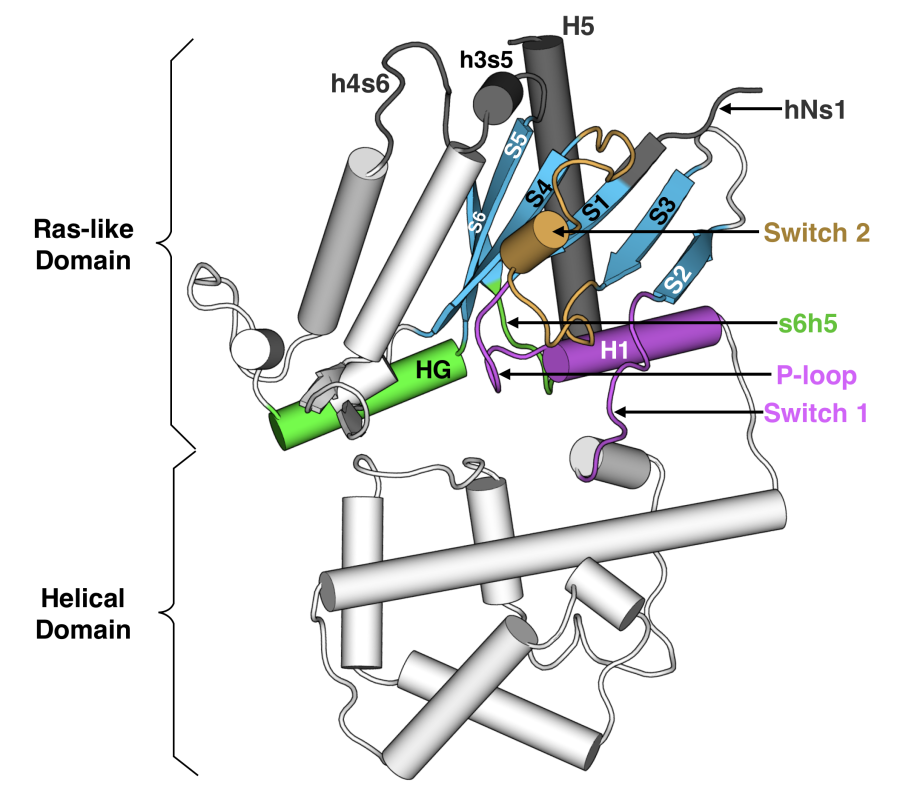
Heterotrimeric G proteins are molecular switches that play pivotal roles in signaling processes from
vision to olfaction and neurotransmission [168, 169, 170]. By default, a G protein adopts an inactive
state in which guanosine diphosphate (GDP) binds between the Ras-like and helical domains of the
-subunit
(G, Fig. 3.1). A dimer
consisting of the -
and -subunits
(G) also
binds G.
G protein-coupled receptors (GPCRs) trigger G protein activation by binding
G
and stimulating GDP release, followed by GTP binding to
G and
dissociation of G
from G.
G and
then interact with effectors that trigger downstream cellular responses.
G
returns to the inactive state by hydrolyzing GTP to GDP and rebinding
G. Given the central
role G plays,
a common G
numbering scheme (CGN) has been established to facilitate discussion of the activation mechanisms of different
G homologs [171]. For
example, the notation Lys52
indicates that Lys52 is the first residue in helix 1 (H1) of the Ras-like domain (also called the GTPase domain, or G).
S6 refers to -strand
6 and s6h5 refers to the loop between S6 and H5.
Strikingly, the GPCR- and nucleotide-binding sites of
G are
30 Å
apart (Fig. 3.1), but the allosteric mechanism coupling these sites to evoke GDP release remains
incompletely understood [169]. Biochemical and structural studies have elucidated some
key steps, but the entire process has yet to be described in atomic detail. Early studies of
G
subunits revealed structures of the GDP- and GTP-bound states, as well as the transition state for GTP
hydrolysis [172, 173, 174]. The high similarity of these structures and the binding of GDP or GTP
deep in the protein’s core suggests that activation occurs by adoption of other conformational states
that allow GDP release [175]. One intermediate in G protein activation was suggested by the first
crystal structure of a GPCR-bound G protein in which the Ras-like and helical domains of
G are
hinged apart and GDP has dissociated [68]. Structural analysis has led to the proposal of a universal
mechanism for G protein activation [171]. In this model, GPCR binding induces translation of H5
away from H1, which increases disorder in H1 and the P-loop (or Walker A motif [173]) to facilitate
GDP release. However, there is evidence that additional intermediates may be involved in
G
activation [169, 174, 176, 177],and the functional importance of this conformational
ensemble has been previously suggested [178]. Furthermore, mutagenesis and nuclear
magnetic resonance (NMR) studies have suggested important roles for other structural
elements [179, 180, 181].
Molecular dynamics simulations promise to capture the entire mechanism of G protein activation and
synthesize the wealth of experimental data on this process. Methodological advances now
enable simulations to capture millisecond timescale processes for proteins with less than
100 residues [182]. For example, it is now possible to capture the binding or release of
small molecules [183, 47, 99, 184, 185] and peptides [186, 187] from small proteins.
Impressive simulations on the ANTON supercomputer have revealed critical conformational
dynamics of G proteins in their inactive and active states, elucidating the role of domain
opening in GDP unbinding [188, 189]. However, even this specialized hardware could not
capture the entire process of G protein activation and GDP release due to the size of the
G subunit
(300
residues) and the slow kinetics of GDP dissociation
(10
min) [190, 191, 192].
Here, we introduce an approach to capture rare or long-timescale events, such as GDP release, and reveal the mechanism of
G activation. As a test of this
methodology, we apply it to Gq,
which has one of the slowest GDP release rates [190] and is frequently mutated in uveal melanoma [193, 194].
To highlight aspects of the activation mechanism that we propose are general to all G proteins, we
focus our analysis on the behavior of secondary structure elements and amino acids that are conserved
across G
domains. Our approach first combines two powerful sampling methods, metadynamics [195] and
Markov state models (MSMs) [196], to observe GDP release and identify the rate-limiting step for
this slow process. Then we use our recently developed CARDS method [90], which quantifies
correlations between both the structure and disorder of different regions of a protein, to
identify the allosteric network connecting the GPCR- and nucleotide-binding sites. The
resulting model is consistent with a wealth of experimental data and leads to a number of
predictions, described below. Taken together, our results provide the most comprehensive
model of G protein activation to date. Based on this success, we expect our approach to be
valuable for studying other rare events, including conformational changes and unbinding
processes.
3.3 Results and Discussion
3.3.1 Capturing G-protein activation and GDP release in atomic detail
We reasoned that studying the mechanism of spontaneous GDP release from a truncated form of
Gq
would be representative of the mechanism of GPCR-mediated activation of the heterotrimeric G
protein while minimizing the computational cost of our simulations. This hypothesis was inspired by
previous work demonstrating that a protein’s spontaneous fluctuations are representative of the
conformational changes required for the protein to perform its function [14, 197, 97].
Therefore, we hypothesized that GPCRs stabilize conformational states that G proteins
naturally, albeit infrequently, adopt in the absence of a receptor. We chose to focus on
G since it
forms substantial interactions with GPCRs, compared to the relatively negligible interactions between GPCRs
and G protein
and subunits.
This view is supported by the fact that GPCRs and ‘mini’ G proteins, essentially composed of just the Ras-like
domain of G,
recapitulate many features of GPCR-G protein interactions [198]. We also reasoned that truncating the last five
residues of Gq
would facilitate the activation process. These residues contact
G
in some GDP-bound structures but not in GPCR-bound structures [199, 200], and
removing these residues promotes GDP release due to a reduced GDP-binding
affinity [201, 202]. Taken together, such evidence suggests that the last five residues of
Gq
help stabilize the inactive state and that removing them would accelerate activation.
In support of this hypothesis, we find that the energetic barrier to GDP release is
lower in metadynamics simulations of the truncated variant than for full-length
Gq (Figure
B.1). These simulations, and those described hereafter, were initiated from an X-ray structure of the
Gq
heterotrimer bound to GDP and an inhibitor of nucleotide exchange [203];
G and
the inhibitor were excluded from all simulations.
To observe G-protein activation, we developed a variant of adaptive seeding [204] capable of
capturing slow processes like ligand unbinding that are beyond reach of conventional simulation
methods. First, we use metadynamics [185, 195, 205] to facilitate broad sampling of conformational
space by biasing simulations to sample conformations with different distances between GDP and
Gq. Doing
so forces GDP release to occur but provides limited mechanistic information because adding a biasing
force can distort the system’s kinetics or cause the simulations to sample high-energy conformations
that are not representative of behavior at thermal equilibrium. To overcome these limitations, we chose
starting conformations along release pathways observed by metadynamics as starting points for
standard molecular dynamics simulations, together yielding an aggregate simulation time of 122.6
s.
These simulations should quickly relax away from high-energy conformations and provide more
accurate kinetics. Then we use these simulations to build an MSM (Source data 1). MSMs are adept at
extracting both thermodynamic and kinetic information from many standard simulations that, together,
cover larger regions of conformational space than any individual simulation [196]. Related
approaches have successfully captured the dynamics of small model systems [206] and RNA
polymerase [207].
This protocol enabled us to capture the entire mechanism of G-protein activation, including GDP
release and the rate-limiting step for this process. Identifying the rate-limiting step for this process is
of great value because GDP release is the rate-limiting step for G-protein activation and downstream
signaling. Therefore, the key structural and dynamical changes responsible for activation
should be apparent from the rate-limiting conformational transition for this dissociation
process.
To identify the rate-limiting step, we applied transition path theory [208, 209] to find the
highest flux paths from bound structures resembling the GDP-bound crystal structure to
fully dissociated conformations. Then, we identified the least probable steps along the 10
highest flux release pathways (Figure 3.2A and Figure B.2), which represent the rate-limiting
step of release. By comparing the structures before and after the rate-limiting step, we
define the bound state as all conformations where the distance from the center of mass
of GDP’s phosphates to the center of mass of three residues on H1 that contact the GDP
-phosphate
(Lys52,
Ser53, and
Thr54) is
less than 8 Å. Consistent with this definition, this distance remains less than 8 Å throughout the entirety
of 35.3 s of
GDP-bound simulations.
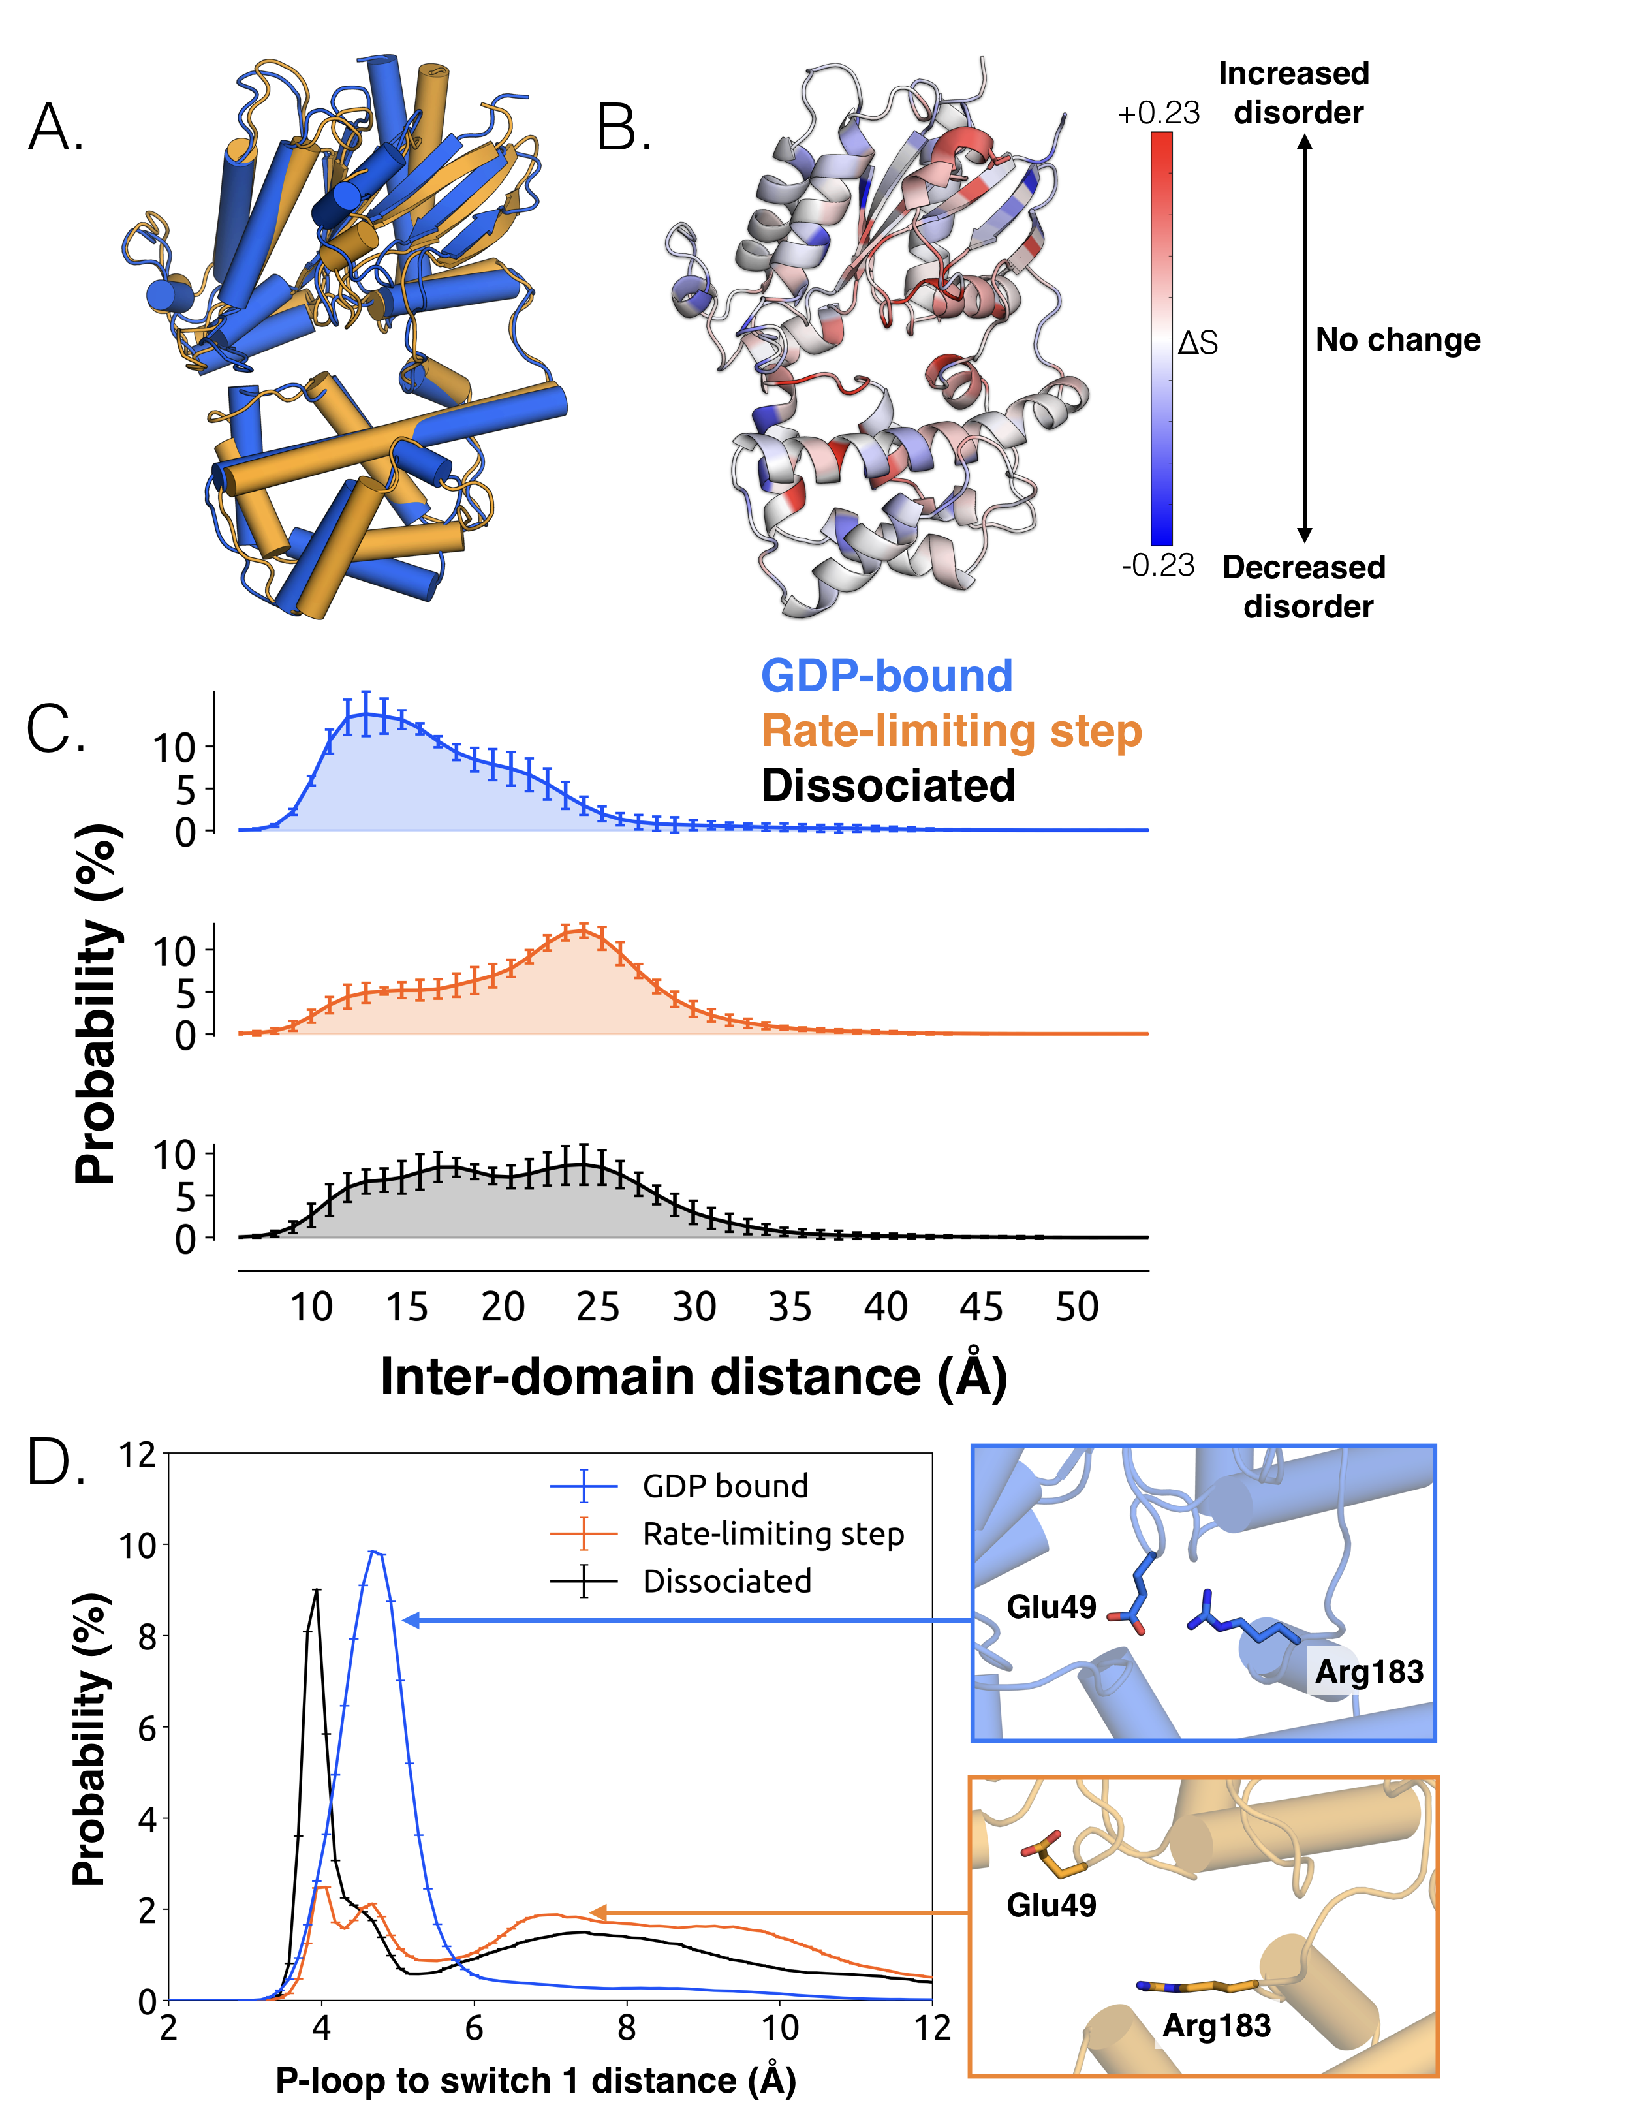
The conformational changes we observe during the rate-limiting step are consistent with previous
structural and biochemical work. For example, we observe that the Ras-like and helical
domains separate (Figure 3.2C), as observed in DEER experiments [210] and previous
simulations [188]. This finding is consistent with the intuition that these domains must separate
to sterically permit GDP release, and that this separation is driven by the disruption of
multiple inter-domain interactions. For example, we note a disrupted salt bridge between
K275 and
D155 (Figure B.4),
previously identified in structural studies [171]. Domain opening is accompanied by disruption of a key salt bridge
between Glu49 of the
P-loop and Arg183
of switch 1 (Figure 3.2D), as well as an increase in the disorder of many of the surrounding residues
(Figure 3.2B and Figure B.3A), consistent with the proposal that this salt bridge stabilizes the closed,
GDP-bound state [176].
While domain opening is necessary for GDP release, previous simulations suggest it is
insufficient for unbinding [188]. Indeed, we also see that this opening is necessary but not
sufficient for GDP unbinding, as the Ras-like and helical domains often separate prior
to release (Figure 3.2C). Notably, the Ras-like and helical domains only separate by
10 Å
during the rate-limiting step. In contrast, these domains separate by 56 Å in the first structure of a
GPCR-G-protein complex. This result suggests that GDP release may have occurred long before a
G protein adopts the sort of widely opened conformations observed in crystallographic
structures [68].
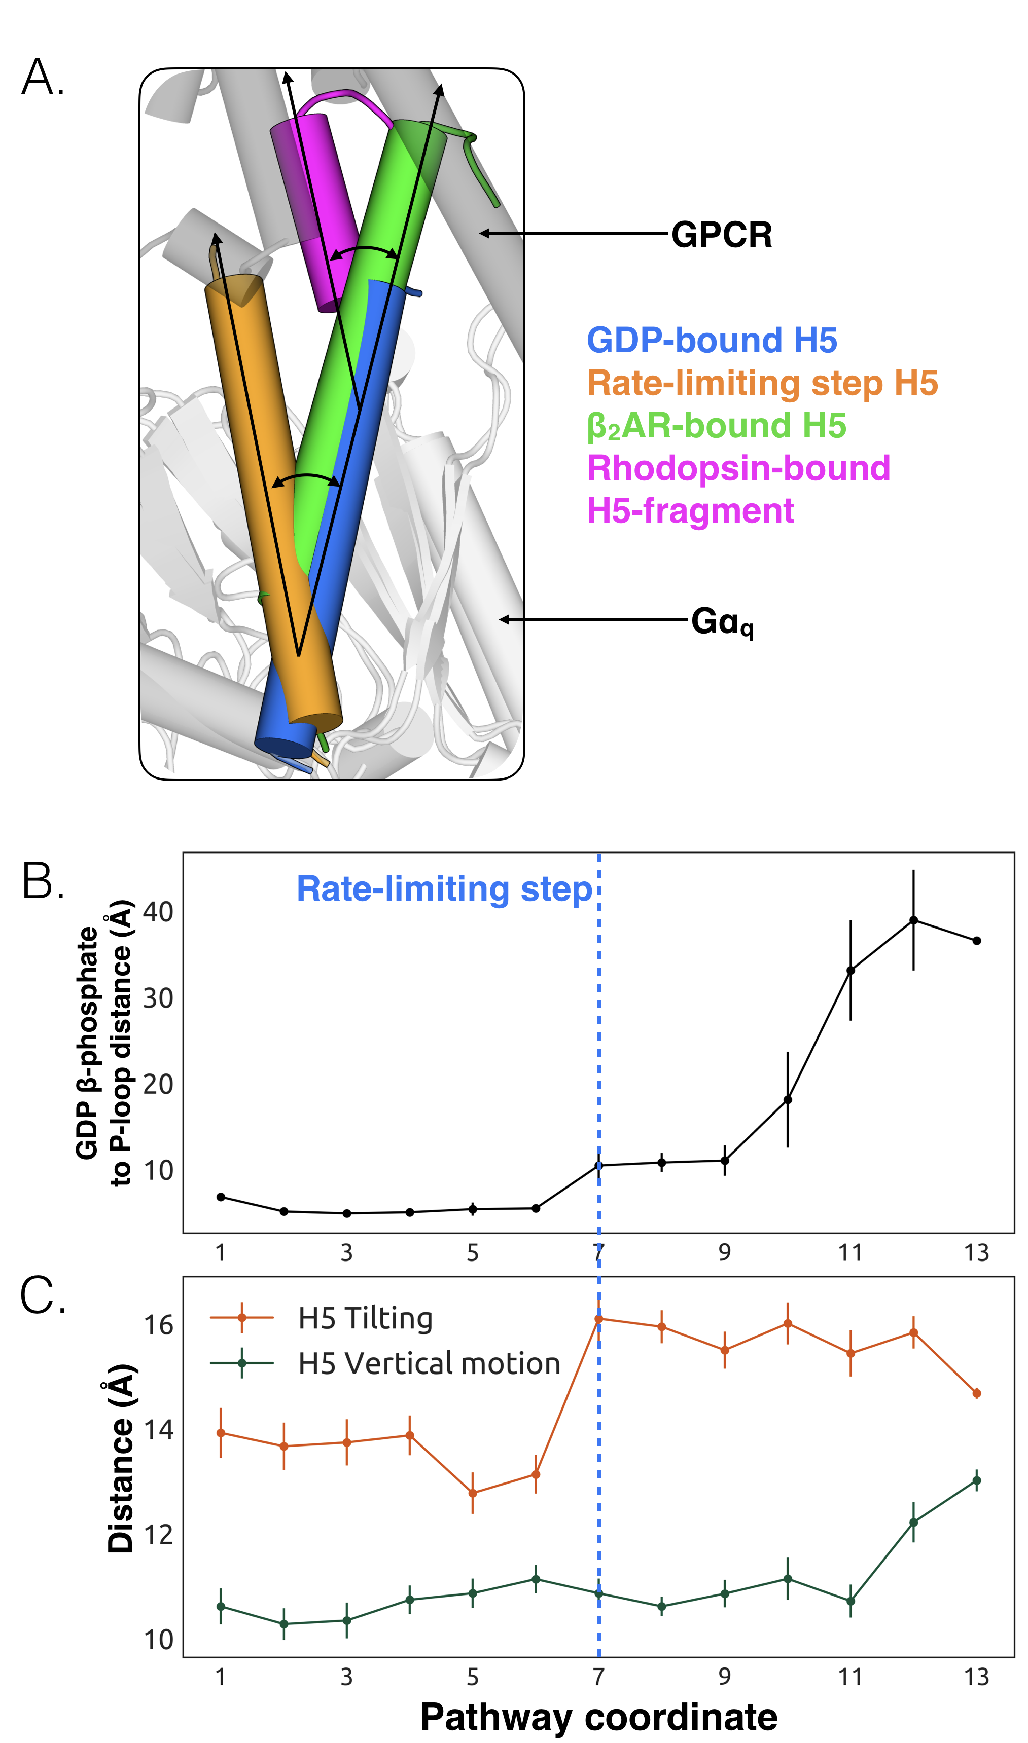
3.3.2 Tilting of H5 helps induce GDP release
We also observe less expected conformational changes associated with GDP release.
The most striking is tilting of H5 by about 26°(Figure 3.3A, and Figure B.6).
We find that H5 tilting correlates strongly with the distance between GDP and
Gq
along the highest flux dissociation pathway (Figure 3.3B and B.1). In particular, substantial tilting of
H5 is coincident with the rate-limiting step for GDP release. This tilting contrasts with X-ray
structures and the universal mechanism, in which H5 is proposed to translate along its helical axis
towards the GPCR, initiating the process of GDP release (Figure 3.3A). During our simulations we
also observe translation of H5, but it is not correlated with the rate-limiting step of GDP release
(Figure 3.3C, Figure B.7). Therefore, we are not merely missing an important role for translation due
to insufficient sampling.
The potential importance of H5 tilting is supported by other structural data. For
example, a crystal structure of rhodopsin [211] with a C-terminal fragment from H5 of
Gt
shows a similar degree of tilting (Figure 3.3A). Also, the tilt of H5 varies in crystal structures of the
2AR-Gs
complex [68], two different GLP-1 receptor-Gs complexes [176, 212], and an A2AR-mini-Gs
complex [198]. The potential relevance of tilting has also been acknowledged by a number of recent
works [171, 68, 213] including four recently published structures of receptor-G-protein complexes
across which H5 also shows a broad range of tilting and translational motion [20, 21, 22, 23].
Interestingly, the tilting and translation we observe falls within the observed range of tilting
and translational motions that H5 undergoes in available GPCR-G protein complex
structures [68, 20, 21, 22, 23], providing support that conformational selection plays an important
role (B.1). Finally, H5 is translated toward the GPCR in the A2AR-mini-Gs structure but
GDP remains bound [198]. The authors of that study originally suggested that one of the
mutations in mini-Gs decouples H5 translation from GDP release. However, given that we see
GDP release without H5 translation in our simulations, it is also possible that amino acid
substitutions required to create mini-Gs instead mitigate H5 tilting. Both of these models are
consistent with the fact that some of the mutations in mini-Gs stabilize the GDP-bound
state [180].
We propose that tilting of H5 is an early step in the GDP release process, which is followed by upward
translation of this helix to form a GPCR-G protein complex primed to bind GTP. This hypothesis
stems from our observation that tilting of H5 is coincident with the rate-limiting step for GDP release,
while translation of H5 only becomes stable after GDP dissociates (Figure 3.3C). This
model is consistent with previous suggestions that G-protein activation occurs through
a series of sequential interactions with a GPCR [169, 68]. Another possibility is that
any displacement of H5, whether tilting or translation, may be sufficient to trigger GDP
release.
3.3.3 Identification of the allosteric network that triggers GDP release
While conformational changes of H5 are important for
G
activation, other regions could also play a role [177, 180]. However, it is not straightforward to
determine what other structural elements contribute to activation or their importance relative to H5.
Our hypothesis that spontaneous motions of a protein encode functionally relevant conformational
changes suggests that the coupling between the GPCR- and nucleotide-binding sites of
G
should be present in simulations of the inactive protein; This provides a means to
identify key elements of this allosteric network. To test this hypothesis, we ran 35.3
s of simulation
of GDP-Gq.
Then we applied the CARDS method [90] to detect correlations between both the structure and
dynamical states of every pair of dihedral angles. Structural states are determined by assigning
dihedral angles to the three dominant rotameric states for side-chains (gauche+, gauche-, and trans)
and the two dominant rotameric states for backbone dihedrals (cis and trans). Dynamical states are
determined by whether a dihedral angle remains in a single rotameric state (ordered) or rapidly
transitions between multiple rotameric states (disordered). These pairwise correlations serve as a basis
for quantifying the correlation of every residue to a target site, such as the GPCR-binding
site. Combining these correlations with structural and dynamical changes in our model of
GDP release provides a basis for inferring how perturbations to the GPCR-binding site
are transmitted to the nucleotide-binding site. We focus our analysis on the most direct
routes for communication between the GPCR- and nucleotide-binding sites by following
correlated motions that emanate from structural elements that directly contact GPCRs until
they reach the GDP-binding site. There are correlations between many other elements of
Gq, including
parts of the helical domain, that branch off of this allosteric network. Such correlations may be important for
aspects of G
function besides activation, but are beyond the scope of the present study, which focuses on how
GPCR-binding impacts nucleotide release.
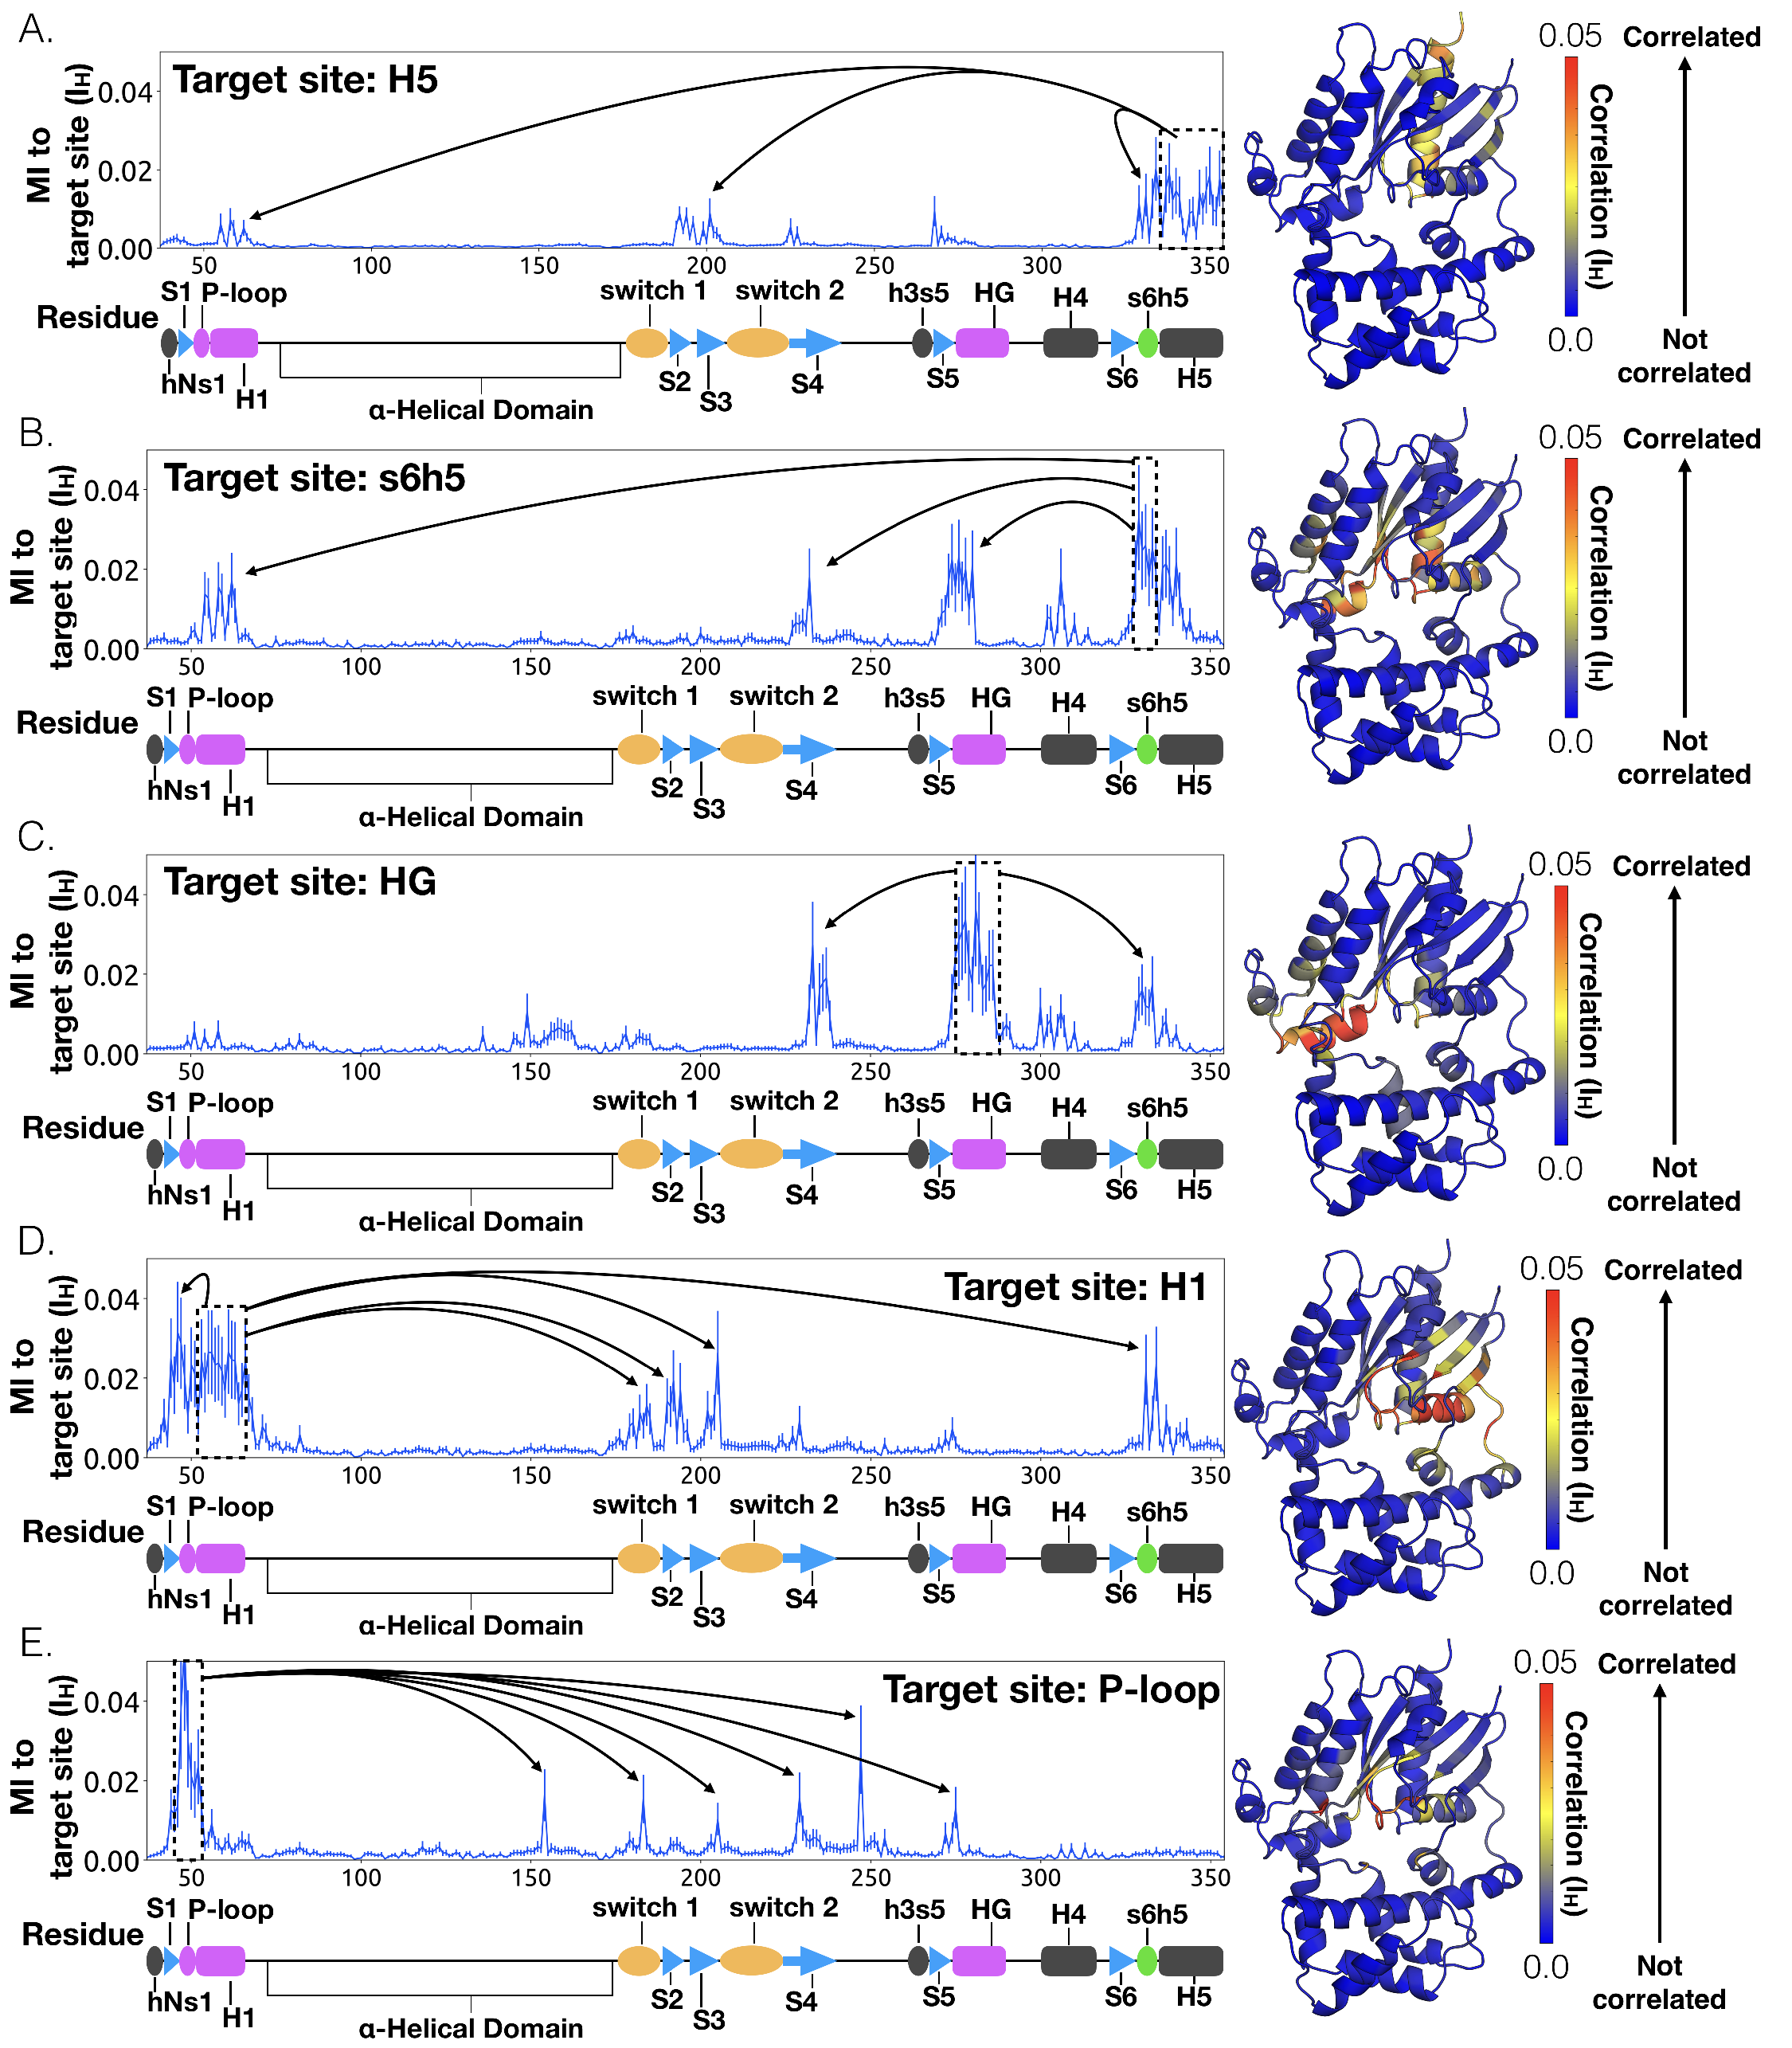
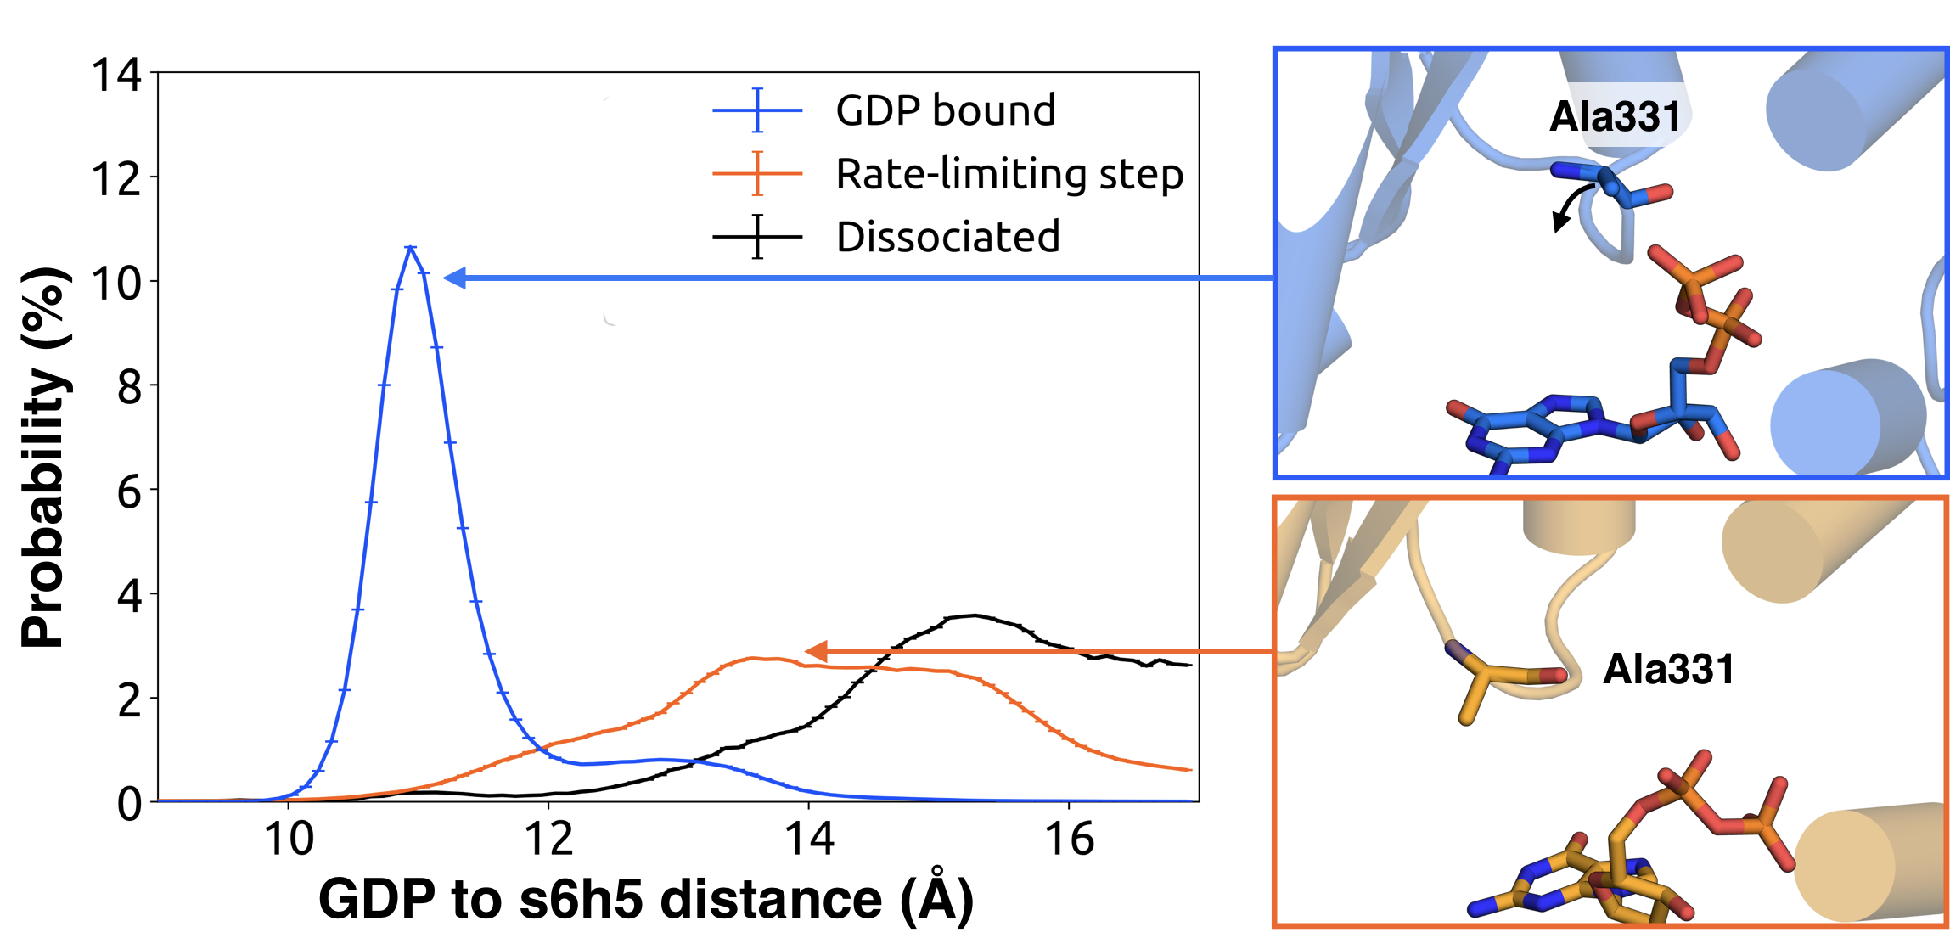
To understand how H5 tilting triggers GDP release, we first identified structural elements with strong
coupling to H5 and then worked our way outward in repeated iterations until we reached the
nucleotide-binding site (Figure 3.4). This analysis reveals that tilting of H5 directly communicates
with and impacts the conformational preferences of the s6h5 loop, which contacts the nucleobase of
GDP (Figure 3.4 and Figure 3.5). During the rate-limiting step, these contacts are broken and there is
increased disorder in the s6h5 loop, particularly Ala331 of the TCAT motif (Figure 3.5 and Figure
B.3B). The importance of the TCAT motif in our model is consistent with its conservation and the
fact that mutating it accelerates GDP release [214, 215, 216]. Based on our model, we
propose these mutations accelerate release by weakening shape complementarity with
GDP.
We also observe an important role for communication from H5 to H1, consistent with the
universal mechanism. In particular, H1 is strongly coupled with the s6h5 loop (Figure 3.4B),
which is sensitive to displacement of H5. In the rate-limiting step, s6h5 moves away from
H1, contributing to an increase in disorder of H1 and the P-loop (Figure B.3A and Figure
B.3B). Increased disorder in a set of residues that directly contact the GDP phosphates
(Glu49,
Ser50,
Gly51,
Lys52, and
Ser53)
likely contributes to a reduced affinity for GDP (Figure B.3A). Increased disorder
in these residues also contributes to disruption of the salt bridge between
Glu49 of the Ras-like
domain and Arg183
of the helical domain, facilitating inter-domain separation.
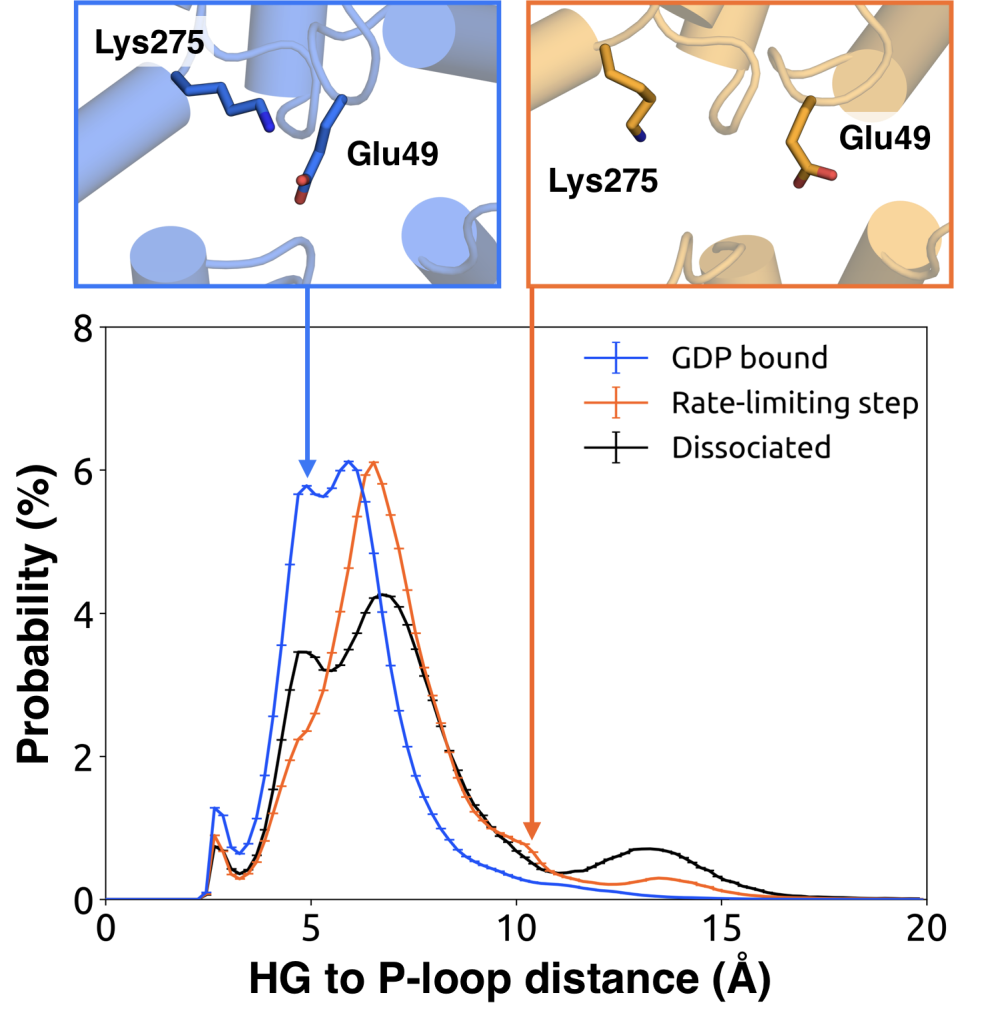
We further note that the s6h5 loop impacts the nucleotide-binding site
through allosteric coupling with the HG helix, which also contacts GDP via
Lys275 and
Asp277
(Figures 3.4E and 3.6). The disorder of both of these residues increases during the rate-limiting
step, consistent with observations of increased mobility in HG upon receptor-mediated
activation (Oldham and Hamm, 2008). There are also correlations between the P-loop and
Lys275
on Helix G (Figure 3.4E), which result from the disruption of a key salt bridge between
Lys275 and
Glu49
on the P-loop during the rate-limiting step (Figure 3.6).
Lys275 is conserved
across all G
families, suggesting it plays an important role in the stability or function of the protein.
However, attempts to experimentally examine the role of this residue by mutating
Lys275
have resulted in aggregation [180]. Our simulations suggest
Lys275
plays an important role in stabilizing the GDP-bound state and that breaking the salt bridge with
Glu49
facilitates GDP release. This finding demonstrates the utility of our atomistic simulations, as we can
examine the role of residues that are difficult to probe experimentally.
3.3.4 H1 and -sheets
are communication hubs
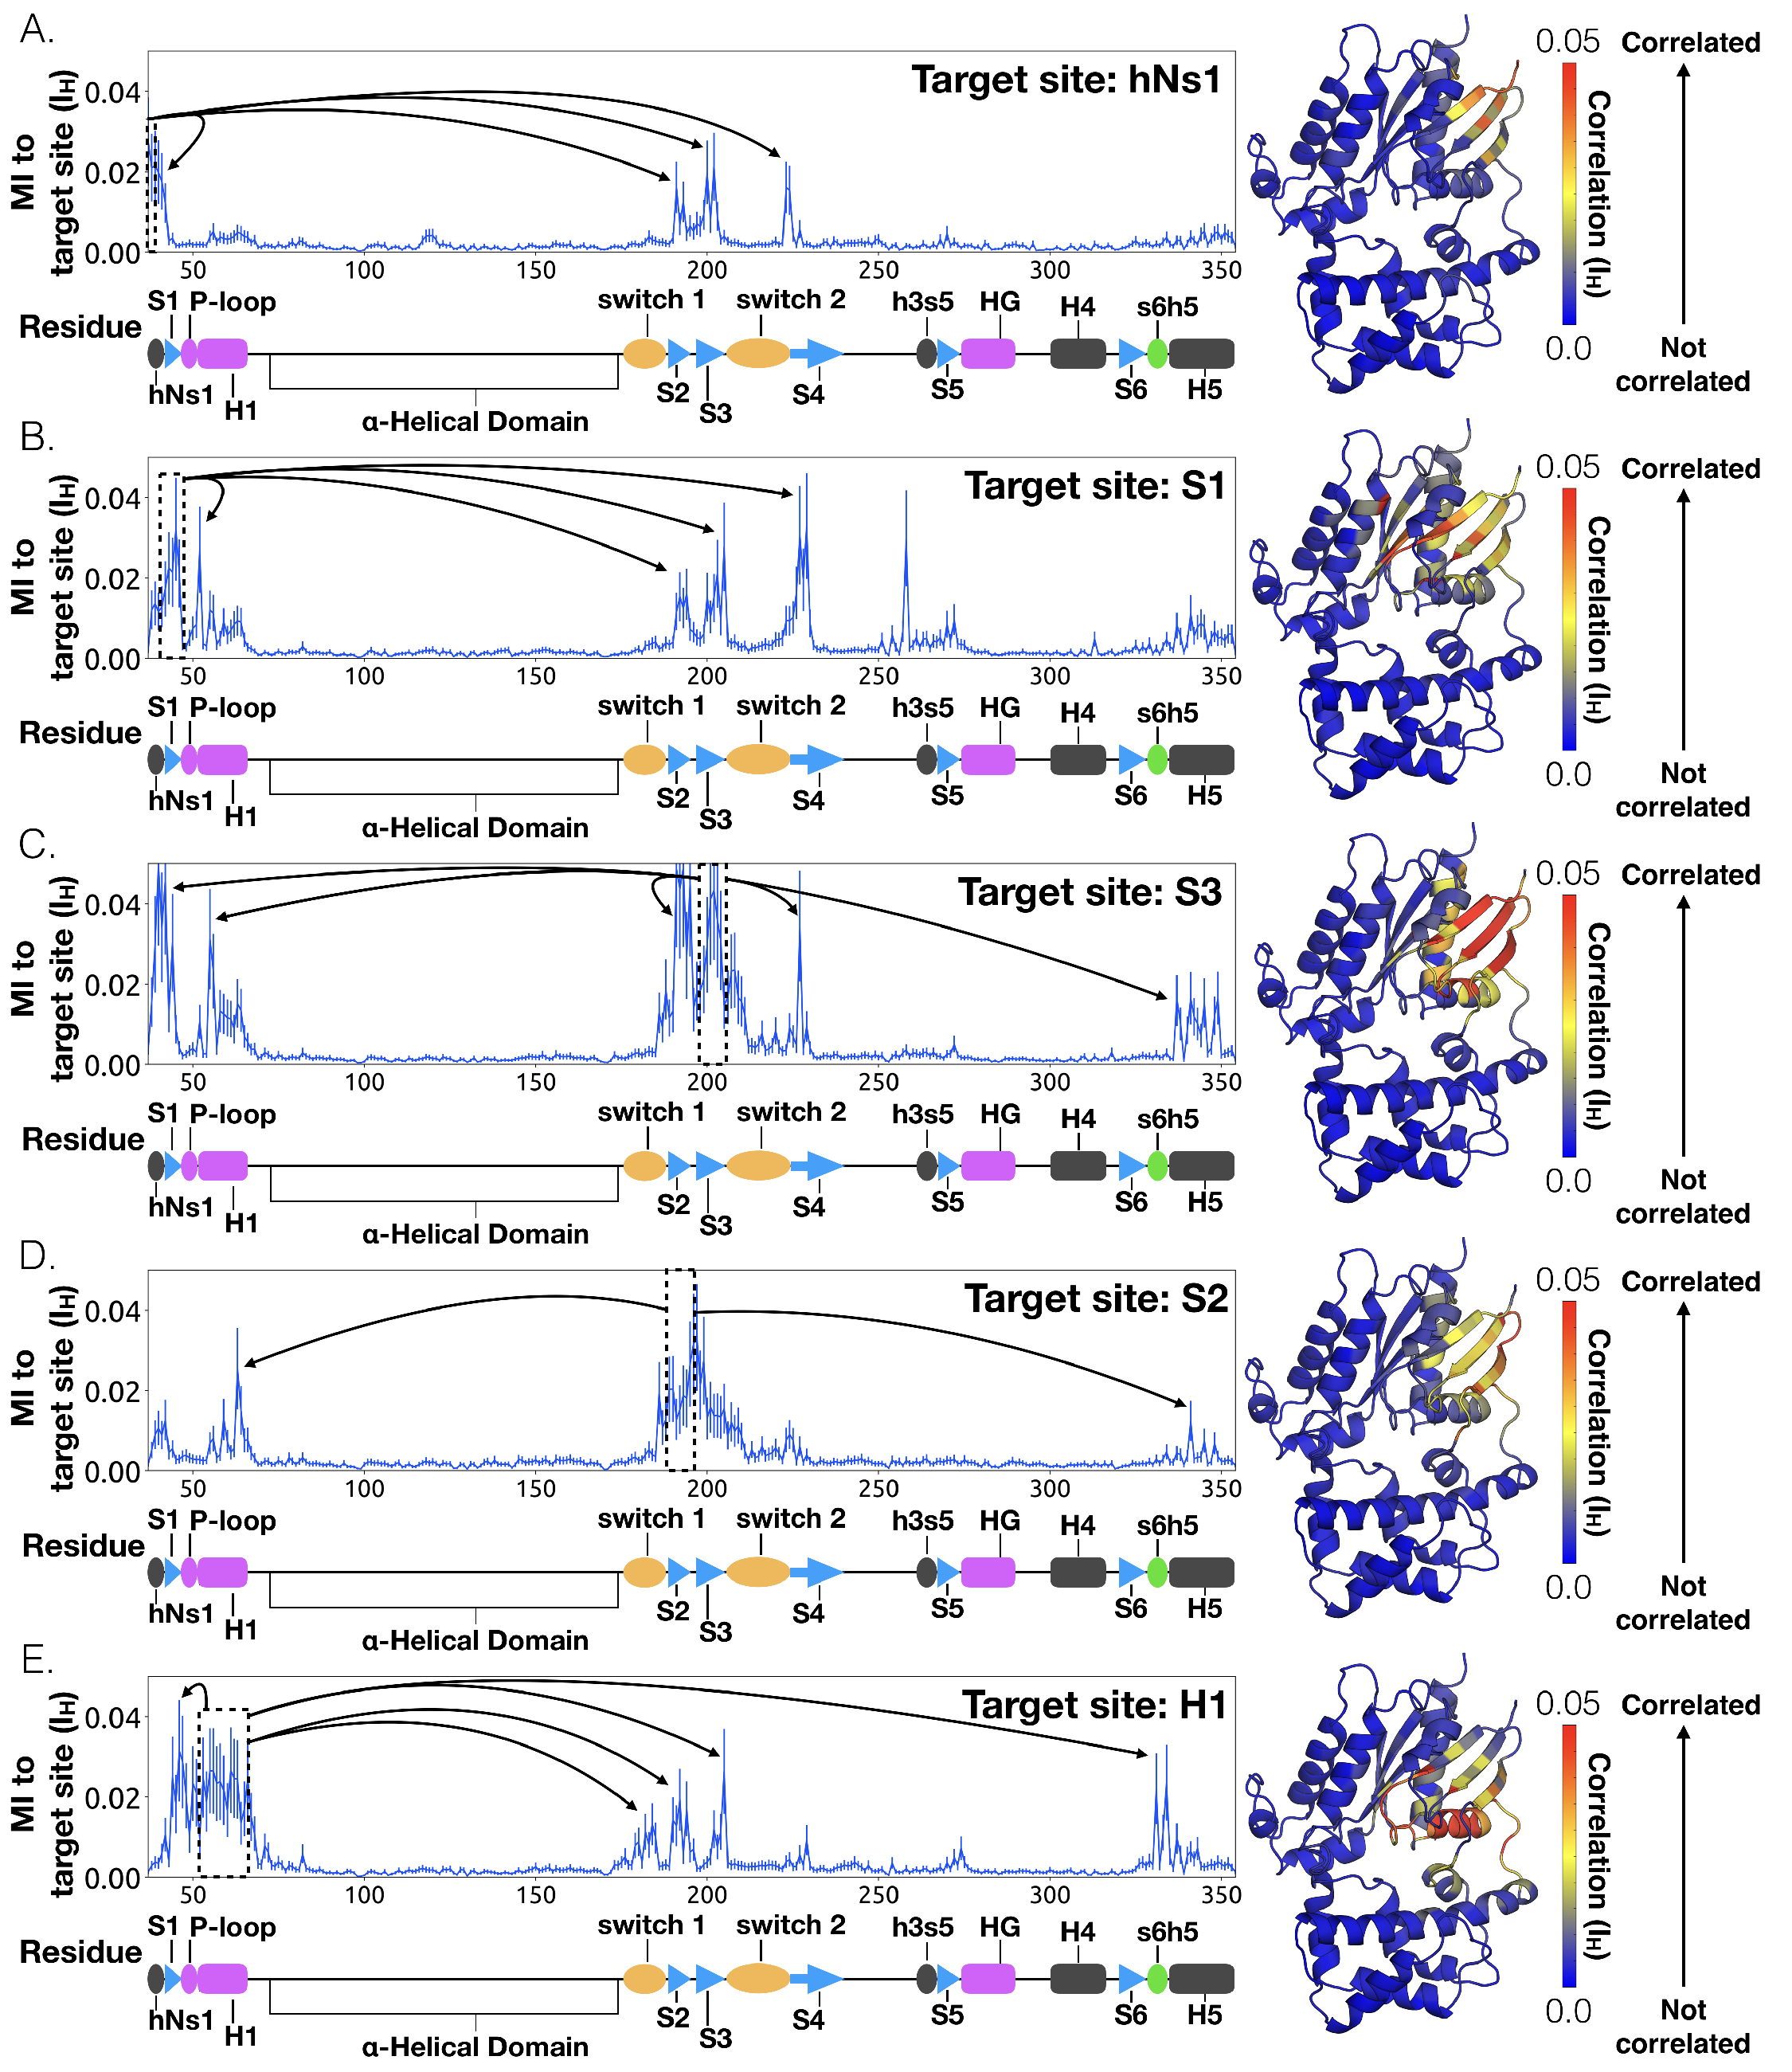
To identify other important structural elements in the allosteric network underlying G protein
activation, we followed correlated motions emanating from other sites that are known to interact
directly with GPCRs, including the hNs1 loop, the h3s5 loop, and the h4s6 loop [169]. We find that
h3s5 and h4s6 are largely isolated, suggesting they play a role in forming a stable GPCR-G protein
complex but not in the allosteric mechanism that triggers GDP release. This finding is consistent with
sequence analysis suggesting these structural elements are important determinants of the specificity of
GPCR-G
interactions [217]. In contrast, the hNs1 loop has strong correlations with
-strands
S1-S3 (Figure 3.7). These strands, in turn, communicate with H1, switch 1, and the P-loop.
Integrating our correlation analysis with structural insight from the rate-limiting step described above
suggests an important role for S1-S3 in a complex allosteric network that couples the GPCR- and
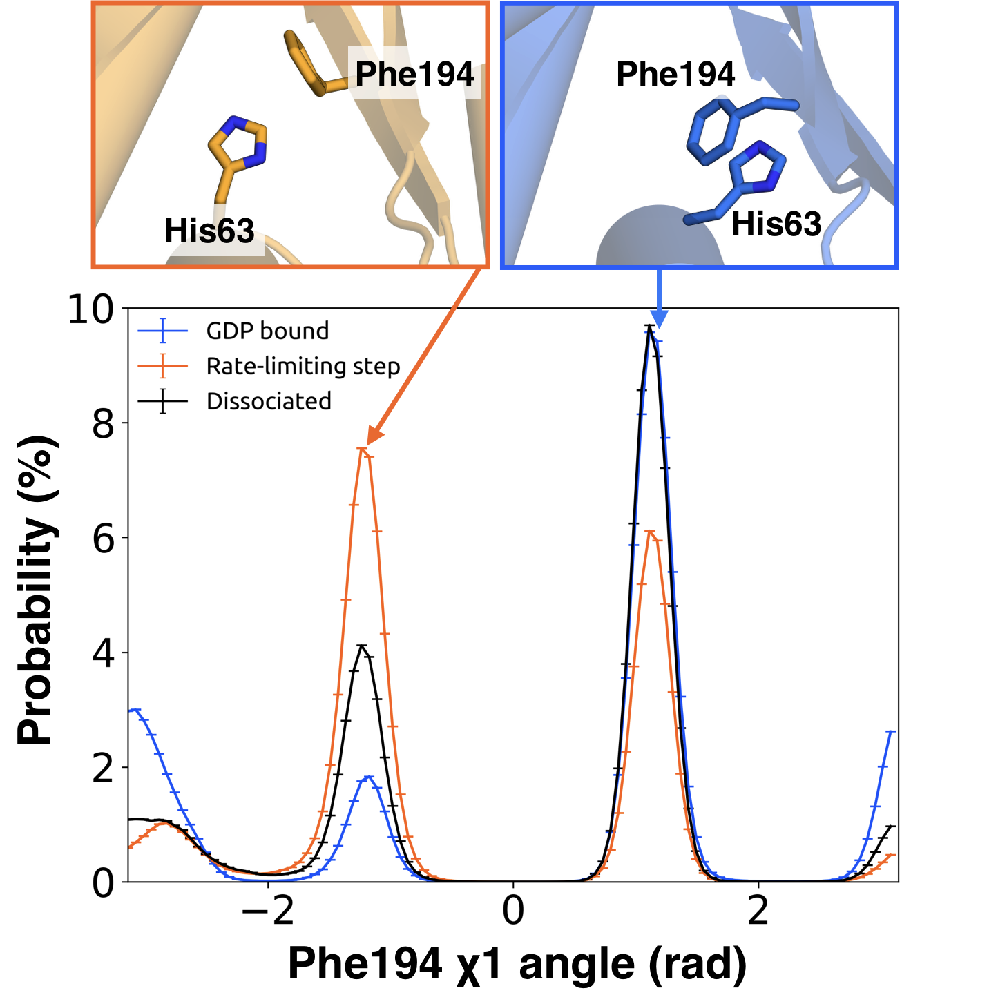
nucleotide-binding sites (Figures 3.7 and 3.8, Figure B.8). S2 and S3 twist relative to S1 and away
from H1 (Figures 3.2A and 3.9, Figure B.10). This twisting disrupts stacking between
Phe194 on S2
and His63
on H1 and increases disorder of side-chains in H1 (Figures 3.2B and 3.9, Figure B.3C).
Increased disorder in H1 is also a crucial component of the proposed universal mechanism,
but in that model translation of H5 is the key trigger for changes in H1. The role for the
-sheets in
our model is consistent with previous work identifying interactions between S2 and H1 [171], NMR
experiments showing chemical exchange in the methyls of S1-S3 upon receptor binding [179], and
mutational data. In particular, Flock et al. have previously noted the important interaction between residues
Phe194 and
His63
[171].
The importance of H1 and -strands
S1-S3 is underscored by mapping the global communication of every residue onto a structure of
G (Figure
B.9). The global communication of a residue is the sum of its correlations to every other residue and is a
useful metric for identifying residues that are important players in allosteric networks [90]. Interestingly,
these -strands
and H1 have higher global communication than H5 and the s6h5 loop. This suggests that H1 and the
-sheets integrate
conformational information from multiple sources, including the hNs1 loop, and not just H5. The importance
of the -sheets
and H1 for allosteric communication is consistent with their conservation [180], which may not
simply reflect the role they play in protein folding and stability, as had been suggested
previously [180, 218].
3.3.5 GDP release alters the structure and dynamics of the
G-binding
site
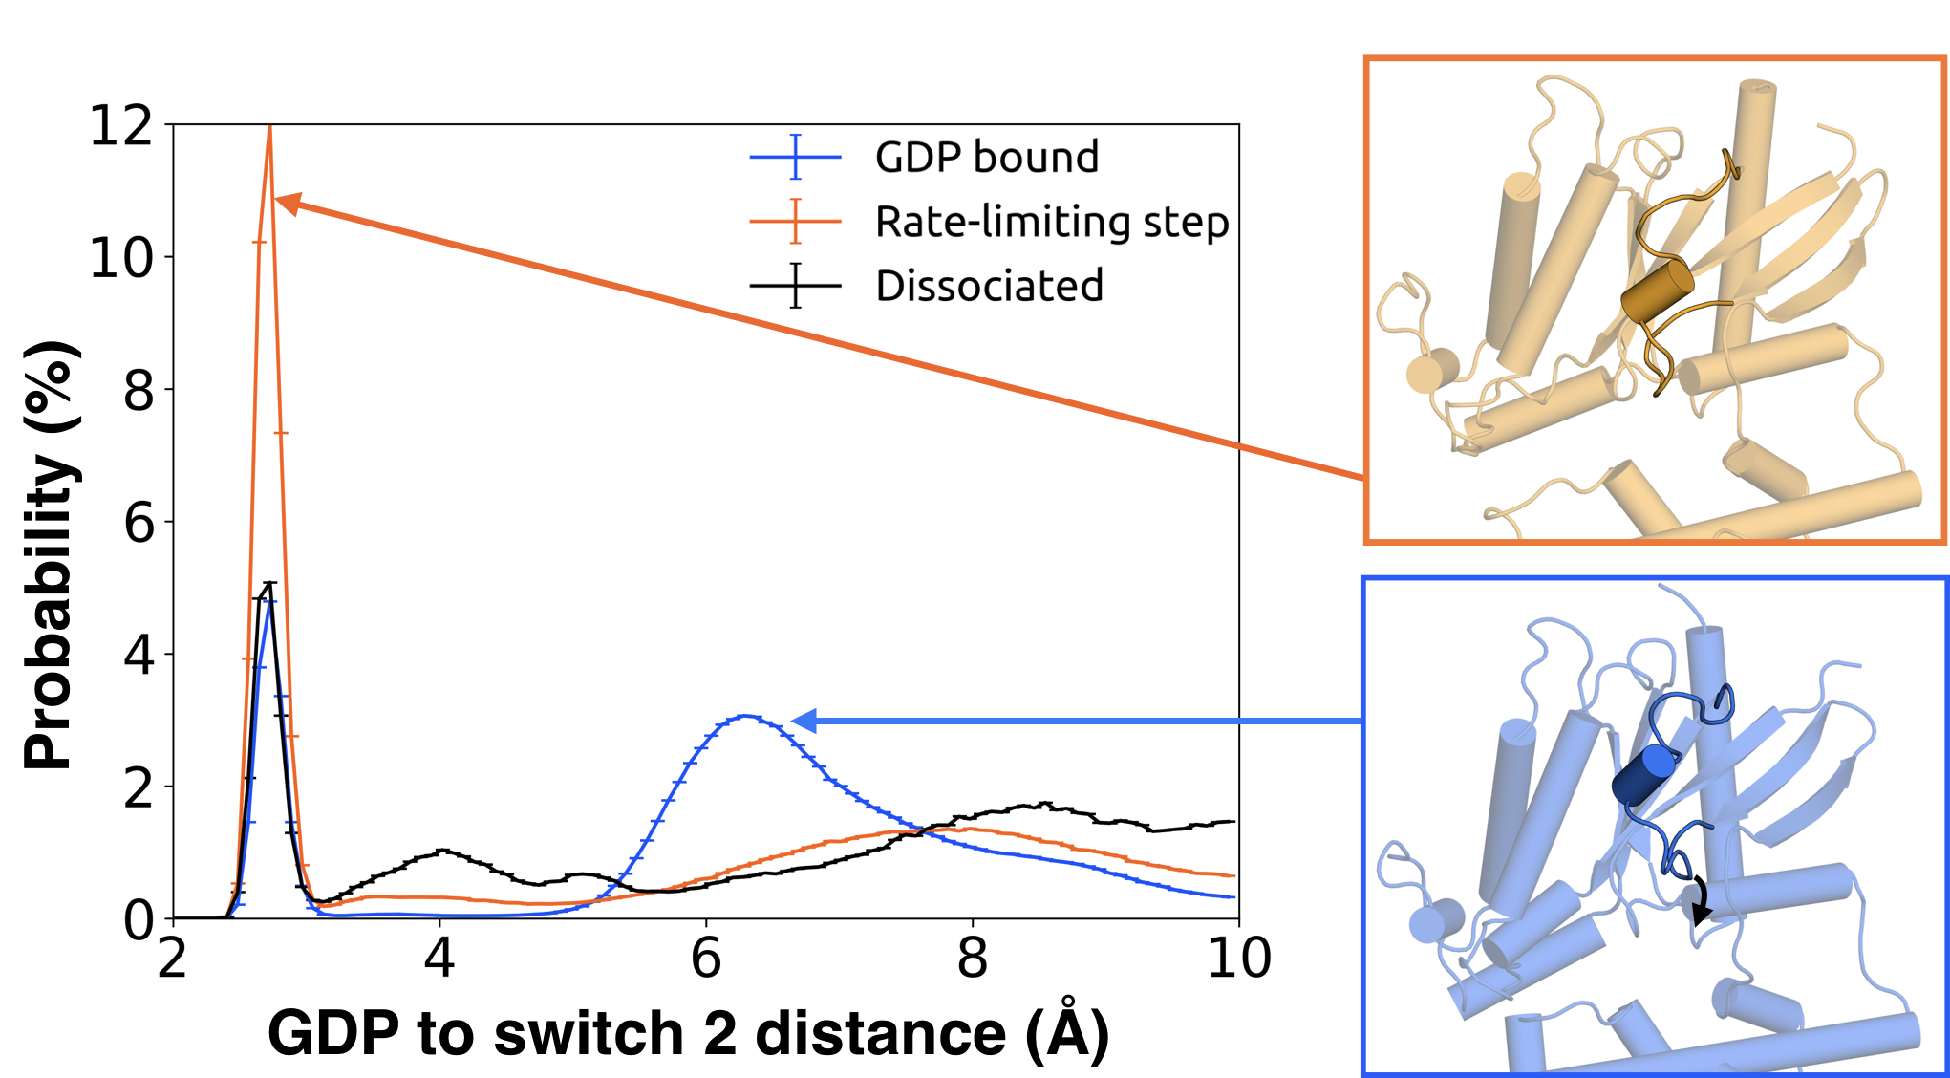
We also find that switch 2 has strong correlations with the nucleotide-binding site, especially
switch 1 (Figure B.8). Given that switch 2 is a major component of the interface between
G and
G,
this communication could enable GDP release to trigger dissociation of
G from
G.
Examining the rate-limiting step for GDP release reveals that switch 2 shifts towards the
nucleotide-binding site (Figure 3.10) and exhibits increased conformational disorder (Figure 3.2B and
Figure B.3). These findings are consistent with previous kinetic studies postulating that switch 2
dynamics are impacted prior to GDP release [219].
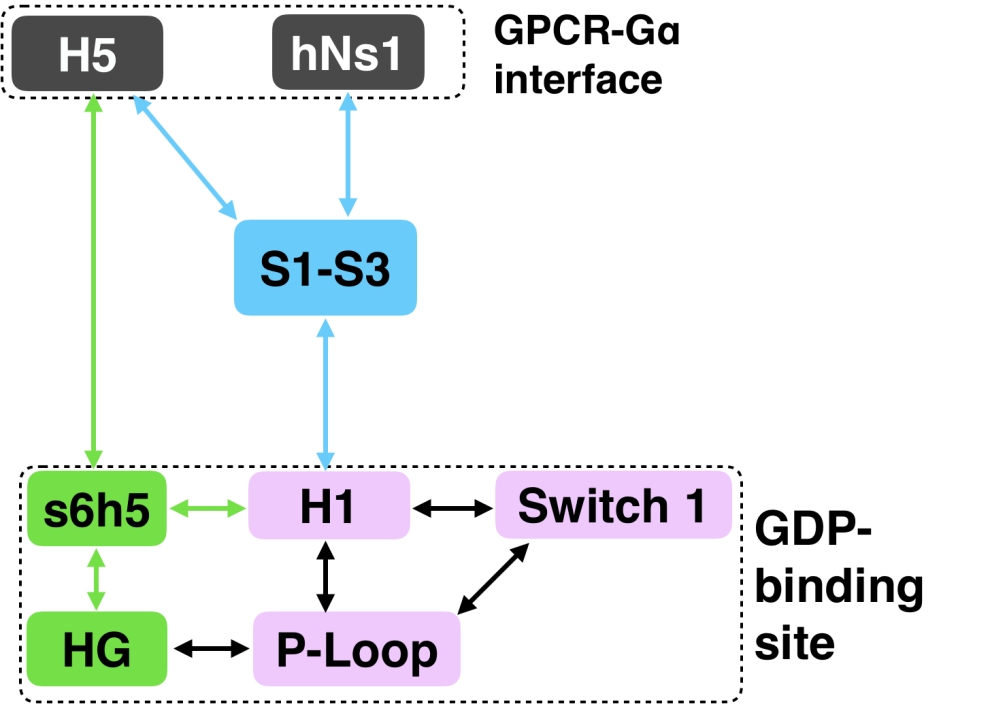
3.4 Conclusion
We have succeeded in simulating G protein activation, including both the
allosteric coupling between the GPCR- and nucleotide-binding sites of
Gq and
consequent unbinding of GDP. Our results reveal a previously unobserved intermediate that defines the
rate-limiting step for GDP release and, ultimately, G protein activation. Our model synthesizes a wealth of
experimental data and previous analyses. For example, we identify an important role for coupling
from H5 to the s6h5 loop and H1 that is consistent with a previously proposed universal mechanism
for G protein activation. However, we also find that this allosteric network incorporates the hNs1 loop,
-strands
S1-S3, and the HG helix. Strands S1-S3 and H1 serve as hubs in this network,
simultaneously integrating information from both H5 and the hNs1 loop. Our observation
is consistent with previous postulates that information flows from H5 and hNs1 to
H1 [220]. It is important to note that our model was extracted using simulations of
Gq,
and so some correlations or changes in conformation and dynamics may apply only to
Gq.
However, by focusing our analysis on secondary structure elements and residues that are shared across
all G
homologs, our model likely captures a universal ‘skeleton’ of changes involved in
G
activation, expanding upon a previously proposed universal mechanism for
G
activation [171]. The consistency of our model with a wide variety of structural and biochemical data
suggests that it is a promising foundation for future efforts to understand the determinants of
GPCR-G
interaction specificity, how mutations cause aberrant signaling and disease, and how small molecule inhibitors
modulate G
activation. Our model also adds weight to the growing appreciation for the fact that a
protein’s spontaneous fluctuations encode considerable information about its functional
dynamics [20, 21, 22, 23]. Construction of our model was enabled by a powerful combination of
simulation methods, namely metadynamics and MSMs. In the future, we expect this methodology
will prove valuable for understanding other slow conformational changes and unbinding
processes.
3.5 Materials and Methods
3.5.1 Molecular dynamics simulations of GDP unbinding
System preparation
We used the crystal structure of G
from the heterotrimeric Gq
protein (PDB entry 3AH8) as the initial structure to set up our simulations [203].
The first 36 residues were removed prior to simulation, as they come from
Gi, along
with the G
and G
subunits which were removed to minimize the system size and maximize our chances of observing
GDP release [169].
The protein structure was solvated in a dodecahedron box of TIP3P water [143] that extended 1 nm
beyond the protein in every dimension. A single Mg2+ ion was added coordinating the
phosphate groups of GDP as its presence accelerates GDP release [221]. Thereafter, Na+ and
Cl were
added to produce a neutral system at 0.15 M NaCl. The final system consists of one GDP, one
Gq, 57
Cl, 64
Na, one
Mg,
and 18696 TIP3P water molecules, for a total of 61,893 atoms.
Molecular dynamics (MD) simulations were carried out using Gromacs [222, 145] and the
AMBER03 force field [146]. The force field parameters of GDP were obtained from the
AMBER Parameter Database (http://research.bmh.manchester.ac.uk/bryce/amber) [223].
The system was energy minimized with the steepest descent algorithm for 50,000 steps
until the maximum force fell below 100 kJ/mol/nm using a step size of 0.02 nm and a
cut-off distance of 0.9 nm for the neighbor list, electrostatic interactions and van der Waals
interactions. Afterward, the solvent was relaxed by a NVT simulation of 100 ps with the
constraint of 1000 kJ/mol/nm applied to the protein heavy atoms and 2 fs as the time step. In
this relaxation simulation, the temperature of the system is constrained to 300 K using
V-rescale thermostat (with a time constant of 0.1 ps) [224]. A cut-off distance of 1 nm
was used for the van der Waals, short-range electrostatic interactions. Periodic boundary
conditions are applied to x, y and z directions. The Particle-Mesh-Ewald method is employed
to recover the long-range electrostatic interactions with 0.16 nm as the grid spacing and
with a fourth order spline [225]. All the bonds connecting to hydrogens are constrained
using LINCS algorithm [226]. After the NVT relaxation, the system further underwent
an NPT simulation for one ns with the time step of 2 fs for equilibration. The simulation
parameters here are kept the same as the NVT relaxation except for the application of
Parrinello-Rahman barostat for pressure coupling [227]. After these equilibration runs, the constraint
on heavy atoms were removed for all subsequent production runs. Virtual sites were used to
allow for a 4 fs time-step [228]. We then applied a three-step protocol to simulate GDP
release.
Step one: MD simulations of the GDP-bound state
We performed 100 parallel simulations of the GDP bound state on the Folding@home [37]
distributed computing environment for an aggregate simulation time of 35.3
s.
Step two: Metadynamics simulations
We subsequently ran metadynamics simulations [195, 229] initiated from conformations generated in
step one to actively promote GDP release. Starting conformations were selected from step one by
clustering protein conformations into 625 states using a hybrid K-center/K-medoids method [230] with a
2 Åcutoff. The 10 most populated states included conformations with large inter-domain separation
distances between the Ras-like and AH domains as measured by the angle formed between the
-carbon atoms
of Leu97,
Asn82,
Ile258, and
Glu250. This inter-domain
angle ranged from 30°
to 0°. From these states, three representative structures were chosen with inter-domain angles of
6°(Conf.
1),10°(Conf.
2), and 26.6°
(Conf. 3) as starting conformations for metadynamics simulations, which were run
on PLUMED [229]. We defined two collective variables for our metadynamics
simulations: 1) the distance between GDP’s phosphate groups and the backbone of
Lys52-Thr54
in Gq
subunit (CV1), and 2) the RMSD of GDP to the starting conformation (CV2).
In metadynamics, a history-dependent biased potential VG(S,t) is added to the two selected
CVs.
|
| (3.1) |
where represents
time, are collective
variables, is the
energy rate and
controls the width of the Gaussian for the ith collective variable. Summing up the Gaussians allows us to obtain the
biased potential .
The free energy
is derived by the assumption,
|
| (3.2) |
The metadynamics simulations were repeated three times for each selected representative structure
using different Gaussian widths (3.1). We set the Gaussian height to 1.5 kJ/mol.
Table 3.1: Details of metadynamics simulations
|
|
|
|
| Starting conformation | Width of CV1 (Å) | Width of CV2 (Å) | Number of conformations selected
|
|
|
|
|
| 1 | 0.1 | 0.1 | 171 |
|
|
|
|
| 1 | 0.08 | 0.03 | 132 |
|
|
|
|
| 1 | 0.03 | 0.01 | 504 |
|
|
|
|
| 2 | 0.1 | 0.1 | 145 |
|
|
|
|
| 2 | 0.08 | 0.03 | 141 |
|
|
|
|
| 2 | 0.03 | 0.01 | 320 |
|
|
|
|
| 3 | 0.1 | 0.1 | 198 |
|
|
|
|
| 3 | 0.08 | 0.03 | 186 |
|
|
|
|
| 3 | 0.03 | 0.01 | 288 |
|
|
|
|
| |
We observed the release of GDP from G
in the metadynamics simulations and obtained the free-energy landscape for the release.
We then applied the string method [231] to detect potential release pathways and use
these conformations as the seeds for simulations in step 3. We can use the function
to
represent
which showing the minimum free-energy path. We thus have
|
| (3.3) |
which is parallel to
|
| (3.4) |
The average of the tensor
|
| (3.5) |
can be represented as
|
| (3.6) |
|
| (3.7) |
The points determining the minimum free-energy path along the surface satisfy
|
| (3.8) |
We applied this method [232, 233] to obtain a minimum free energy path, extracting 2085
conformations along potential GDP release pathways. Notably, we only observed the transition from
the bound state and the unbound state for one time in a single metadynamics simulation. This implies
that the predicted free-energy surface from metadynamics cannot be used to describe the release
events accurately. In spite of this, we can still use the conformations along the release pathway
explored by metadynamics to seed unbiased parallel MD simulations.
Step three: Metadynamics-seeded MD simulation of GDP release
Lastly, we carried out unbiased MD simulations initiated from the 2085 conformations
obtained from metadynamics using the Folding@home platform [37]. A total of 122.6
s of
simulation was generated in this step. All the following analyses are based on unbiased MD
simulations.
3.5.2 Identifying the allosteric network with CARDS
To determine how the GPCR- and GDP-binding regions communicate with one another,
we applied the CARDS [90] methodology to simulations of the GDP-bound state of
Gq.
CARDS measures communication between every pair of dihedrals via both correlated changes in
structural motions and dynamical behavior. Structural states are captured by discretizing backbone
and
dihedrals into two structural states (cis and trans), while side-chain
angles
are placed into three states (gauche+, gauche-, and trans). Every dihedral is also parsed into
dynamical states, capturing whether the dihedral is stable in a single state (ordered), or rapidly
transitioning between multiple states (disordered). These dynamical states are identified using two
kinetic signatures of dihedral motion: the average time a dihedral persists in a structural
state (an ordered timescale), and the typical timescale for transitions between structural
states (a disordered timescale). Parsing into dynamical states utilizes a two-step process by
(i) calculating the distribution or ordered and disordered times from the simulations and
(ii) assigning each period of time between two consecutive transitions into ordered and
disordered states based on which distribution the time between two transitions is most consistent
with.
From these states, a holistic communication ()
is computed for every pair of dihedrals
and :
|
| (3.9) |
where is
the normalized mutual information between the structure (i.e., rotameric state) of dihedral
and the structure
of dihedral ,
is the normalized mutual information between the structure of dihedral
and the dynamical
state of dihedral ,
is the normalized mutual information between the dynamical state of dihedral
and the structure
of dihedral ,
and
is the normalized mutual information between the dynamical state of dihedral
and the dynamical
state of dihedral . The
Mutual Information ()
is
|
| (3.10) |
where refers to the set of
possible states that dihedral
can adopt, is the
probability that dihedral
adopts state , and
is the joint probability
that dihedral
adopts state
and dihedral
adopts state .
Normalized mutual information is computed using the maximum possible mutual information for any
specific mode of communication.
From the pairwise correlation for every dihedral-pair, we extracted how much each individual residue
communicates with a target site of interest via bootstrapping with 10 random samples with
replacement. After locating the group of residues communicating most strongly with a specific target
site, we set this newly identified group as the new target site; The iteration of this process
allows us to identify a pathway of communication from one region of interest to another.
Here, we set the GPCR contact sites as our initial target sites. We then iteratively used this
approach to identify pathways connecting these contact sites with the GDP-binding site of
Gq.
3.5.3 Markov state model construction
We clustered Gq
conformations and GDP binding states separately and combined the assignments to build a Markov
State Model using MSMbuilder [230, 234] and enspara [39]. First, we clustered protein
conformations into 5040 states using a hybrid k-center/k-medoids method with 1.8 Å cutoff. Then we
clustered the GDP-binding state into 321 states using the automatic partitioning algorithm
(APM) [235] with a residence time of 2 ns. By combining the assignments from protein
conformations and the GDP-binding states, we obtained a total of 221,965 states. The
implied timescales of this MSM show Markovian behavior with a lag time of 5 ns [236].
(Figure B.5). Analyses of distances, angles, and dihedrals of interest were carried out using
bootstrapping with ten random samples, with replacement. Results were insensitive to varying the
number of bootstrapped samples between 5 and 30. Histograms were generated using 100
bins.
3.5.4 Quantifying conformational disorder
The disorder of every residue was measured by computing Shannon entropy [237] of each dihedral as
they are natural degrees of freedom for describing protein dynamics. Shannon entropy
() is
defined as
|
| (3.11) |
where refers to the set of
possible states that dihedral
can adopt and is the
probability that dihedral
adopts state .
Dihedral angles were calculated using MDTraj (McGibbon et al., 2015) and assigned to discrete
rotameric states as described above using CARDS. The entropy of a single residue was computed by
summing up the entropies of its dihedrals, and normalized by the residue’s maximum possible
Shannon entropy. This maximum possible Shannon entropy, using a flat distribution for the
appropriate number of bins, is referred to as the ’channel capacity’ and has been used to normalize
other information-theoretic metrics [90]. Summing entropies within a residue establishes an upper
bound on the degree of motion for a single residue, while ignoring intra-residue correlations between
dihedrals.
3.5.5 Identification of the rate-limiting step for GDP release
We used transition path theory (TPT) [208, 209] to find the highest flux paths from
the bound state to the unbound state [238]. The bound state was defined as all
clusters that satisfied two criteria: (i) GDP is within 6 Å of the backbone atoms of
Lys52-Thr54,
and (ii) GDP has an RMSD
to its crystallographic conformation. The unbound state was defined as all clusters with GDP
from the binding pocket. The rate-limiting step was identified by finding the bottleneck
in the highest flux paths. To obtain this, we first calculate the flux between states
and
along
any possible unbinding path using
|
|
where
is the committor probability from the bound to the unbound state, and
is
;
is the weighted
probability, and
is the transition matrix. The highest flux paths can be identified by maximizing the fluxes between the
bound states and the unbound states using
|
| (3.12) |
where
are intermediate states. From this, the slowest step was extracted as the minimum flux step of the
highest flux release pathway.
3.6 Acknowledgements
We thank TE Frederick and TD Todd for their helpful discussion and insight. We are grateful to the
Folding@home users for computing resources.